The Economic Downturn is Coming. Are You Ready for Greedy Growth?
Trade wars have sent steel prices up twenty five percent and farmers are getting killed by the collapse of the agricultural commodities market. Job growth slowed to a paltry 75,000 in May, and the two prior months of April and March were revised downward by 75,000. The European Central Bank is already easing monetary policy and hinting at future stimulus measures to fend off weakness in the Eurozone economy. Jerome Powell, the head of the US central bank, just telegraphed a rate cut. Brexit is a mess with all manner of political and economic uncertainty driving the UK economy into a contraction. Chinese investors are pulling out of the US real estate market due to retaliatory regulations associated with the trade wars.
A downturn in the economy is coming. It always comes, and the signs are everywhere that the happy days are close to an end. When the easy-money construction market dries up, will your contracting business still be poised for profitable growth? Will you be ready to take advantage of your weak competitors? Or will you be one of the weaklings that struggles to keep the wheels on the bus as competitors sharpen their knives in the battle for the stability of a highly profitable service business?
Warren Buffet is fond of saying “When others are greedy, be fearful. When others are fearful, be greedy.” What steps should you take to exercise fear now and be greedy when the downturn comes? Here are some ideas to prepare for greedy growth during the downturn.
Lock In Service Contracts Now
The last thing you want during the downturn is for your best customers to be shopping for service or responding to the desperate sales pitch of the low price competitor who is getting killed in the downturn (and hence getting more desperate and lowering prices even further). Customers can always breach a contract, but most will not want to do that, or they will simply ask for some consideration (payment terms, maybe a slight rate cut) in a down economy. Get on the right side of this negotiation now by offering a good contract that commits you to the services that will keep their facilities in top shape during the boom times when others are out chasing new construction opportunities.
Optimize Website SEO with Reviews
When the weak competitors begin to go belly up, or more likely they fail to make payroll and their technicians begin looking for the next opportunity, you want your company to be the number one hit (and number two and three and four as well) on the search engines. The downturn is prime-time to lock in new technicians who discover their employer is a weak player. They will be looking online. Will they find you? They will if you have your online reviews juicing your SEO results.
Get Your Careers Page Looking Spiffy
Hiring is difficult, but it is even harder when no one knows what types of positions you are offering. Always list openings for skilled technicians on a careers page on your website. Be specific about the skills that you value and the unique capabilities of your company, including any special technology capabilities that you deploy in service to your customers. Being specific about these things is better than simply declaring your company is better because you work harder, care more, been around longer, love mom and apple pie and blah blah blah.
Upgrade Your Customer Service Technology
When competitors begin their desperate attempt to keep customers at all costs, you want to be the one that has the most leverage in the fight for keeping the best customers. If you have put in place systems that help you understand customer contract performance, equipment maintenance condition, and technician productivity and revenue performance, you will be in the best negotiating position possible.
You will be able to reward good customers that follow maintenance protocols and repair recommendations with better rates while letting the customers with a history of poor maintenance and disruptive emergency calls fall to the competitor. Let them have the aggravation and low rates for these customers.
You will also be able to provide more competitive rates when you can use technology to maximize technician productivity and minimize wasted unbillable time. If you can increase their billable productive time by 10%, you can lower rates by 10% if necessary to keep the good customers from making a mistake and switching to Desperate Don.
Offer Customers Unique Capability and Insights
Although this is a capability that should be part of your customer service technology upgrade, it is worth mentioning as a separate item. In a world of Amazon and Uber, customers will expect their suppliers to give them more than just the labor and parts they bargained to buy. They expect information and insights as part of the customer service experience, and they expect them to be delivered online.
Challenge the customer that is about to make a mistake by switching to Desperate Don to make Don prove that he can provide the unique, information based and convenient experience that comes with your service. If the customer works with Don, can they:
See evidence of the work performed online?
Review and approve quotes online?
Review equipment service and repair history online?
Request service online?
See the progress of the technician online as he executes the maintenance routine on a complex site?
Maybe they will turn Don’s desperate offer down when he cannot provide any of this customer experience value.
Are you ready to be greedy when others become fearful? The key is having the confidence that you are operating with the best information to provide the best experience with maximum technician productivity so that you can aggressively hire and sell. When you know that the sale is going to stick and technician productivity is going to be high, you can hire and sell and hire and sell when others are struggling and become tired as hell of trying to figure out how you do what you do. Let’s hope the downturn is soon so the best competitors can wipe the floor and benefit from some greedy growth.
Cyber Attacks in Fire and Life Safety
In 2019, there’s a fresh wave of ransomware hackers targeting US-based fire and life safety contractors that have legacy server systems. Several have been either forced to pay a bounty or face devastating disruptions when the cyber attack is unleashed. If you believe you are safe because no one is going to notice or care about your business, you are wrong. And the weakest link on your network that hosts your legacy server systems is no match for the professional criminals that are extorting you.
Now is the time to move all of your critical customer operations data to a modern cloud architecture. It is no longer a matter of being competitive in customer operations in your market. It is now about a choice to remain an ongoing business concern or be wiped out by a cyber criminal. The idea that you want to connect all of your technicians and all of your customers to a server on your network for them to collaborate in delivering your service value opens up innumerable vulnerabilities. It is just a crazy idea. If instead, they are all connecting to Amazon’s network (all ServiceTrade applications are protected by Amazon’s security) or Google’s network or Microsoft’s network, you are largely insulated from attack.
No one keeps their financial assets in a safe on their property any longer – they trust a commercial financial institution to be a good steward and use computers to deliver interesting applications to protect those assets while growing their value. It is time to take the same approach with what is arguably the most valuable asset of your business – your customer operations data. Who do you serve? What is the schedule? What equipment do they have? How do they pay you? What is your contract with them? What new opportunities for revenue are at their locations? If this information is protected by Amazon or Google or Microsoft, your business can continue to deliver value everyday. If it is vulnerable because of a legacy server on your network, that value can slip away pretty quickly. Don’t lose what you have worked so hard to build simply because you did not take the time to transition to a modern customer management platform.
Need help buying SaaS software?
You’ll always make good software-buying decisions when you follow the 6 pieces of advice in the Software Buying Guide for Commercial Service Contractors. Download and read it here.
Avoid This Pitfall When Going Paperless
When we talk to commercial service contracting companies about going paperless, the conversation usually starts with how they envision paperless processes will benefit their back offices by saving time and money. They want to send invoices faster, save money on postage, and reduce tech phone time.
Going paperless definitely results in these and other improvements in administrative efficiency. But once companies start making the transition, we usually hear that it takes their techs longer to fill out a form on a tablet or their phone than it did on paper. And we don’t disagree with them. Pencil whipping paperwork is just faster.
However, these same companies find that moving the information online is worth every bit of additional effort when the ultimate goal is to make your customers’ lives easier. Going paperless necessarily means capturing, organizing and communicating that information in a more effective way that meets (and hopefully exceeds) your customers’ expectations. If you focus solely on the administrative efficiencies, you’ll miss the bigger picture – the opportunity to improve the customer experience and drive scalable growth.
What Do Your Customers Expect?
In short, they expect access to the information they want, when they want it. (You can thank companies like Netflix and Amazon for this on-demand mentality.) Remember when you used to have to watch the local news to get the weather forecast? Or better yet, when the Weather Channel made everyone’s lives a little bit better when they brought us weather every ten minutes through their segment local on the 8s? Today, you just open your favorite weather app on your phone, or, if you’re like my 5 year old, you just ask Alexa.
Your customers’ expectations are similar when it comes to engaging with you. Imagine a facility manager or building owner who has been running between meetings all day. He finally gets some desk time – at 9 pm, and wants an update on the work that was performed by your techs earlier that day. He needs details now and he can’t wait to call your office tomorrow morning when your first staff person arrives at 8 am.
How Going Paperless Improves Customer Experience
The most detailed information in the world is of little use to your customers if it’s all on paper copies of quotes, work orders, and invoices filed away somewhere in your office. Or if they have to call your office during normal business hours to get it. Let’s look at a few ways going paperless improves the customer experience and strengthens customer relationships.
The customer can engage with you 24/7 from any device.
Like I said, today’s consumer expects access to the information they need, when they need it. We can do everything from our phones these days. Order groceries. Buy a birthday present. Make a tee time. Why not make it as easy as possible for your customers to engage with you? So whether they need to submit a service request, review the work your techs did that day, or approve a quote, they can easily do so from their computer or phone.
The customer can speak with any employee to get an update.
They don’t have to wait until you track down the person (or people) who did the work. So when a new tech goes out on a service call, he can quickly see what work has been done on a piece of equipment by previous techs by looking at the service history. He can immediately jump into an intelligent conversation with the customer, and not have to tell the customer he’s going to have to get back with him after he makes a phone call.
Building trust isn’t limited to face-to-face interactions.
As you grow, it’s difficult to scale the personal touch that you built your company on. The good news is, going paperless provides ways to build trust through online interactions with customers. You can’t attach pictures, videos, and audio notes to paperwork. You can’t tell a rich story about the services provided with paperwork. All you get is chicken scratch in broken English. Going paperless means collecting rich media in an organized way that lets you easily share it with your customers and show them what’s going on with equipment.
Share urgent or essential information with customers in real time.
I remember the first time my weather app sent me a push notification about a serious storm that was sweeping through the area. I was about to leave my office and head home. Because of that notification, I made the safer decision and delayed my commute until the storm passed.
You can do the same for your customers. Take the facility manager or building owner from my earlier example. Would he prefer to be notified about a serious equipment issue while you are on site and can address it, or wait to get a call about it later, which forces him to schedule another call and wait for you to come back out? You guessed it. When it comes to information that is essential to your customers, sooner is better. Pushing notifications to your customers regarding essential or urgent information will set you far ahead of your competition.
Ready to Get Started?
Anyone who started down the road of going paperless will tell you it takes more than scanning all those piles of paper into pdfs and saving them to your desktop. Going paperless is a big step in the bigger journey of digital transformation – a journey that requires a company to take a closer look at their business processes and how they deliver customer service.
To realize the full benefits of going paperless, don’t limit your business by thinking small and focusing solely on administrative efficiencies. The real value is in improvements to customer engagement and service. A better customer experience means happier customers and a competitive advantage in your market. Going paperless allows you to leverage the power of the internet to drive truly scalable growth.
End of Quarter Questions for Commercial Service Companies
Think back to the start of the year – did you set goals for your business? Of course you did. But how do you know your goals are focused on the right things? That you are monitoring the right numbers?
To help make sure you are on the right track, we’ve put together three questions for you to answer. The end of the quarter is a great time to run a diagnostic check on your company’s performance.
Don’t avoid this exercise just because you are nervous about what the numbers might tell you. A clear understanding of where you stand currently is essential if you want to set realistic goals that will move your business forward.
Here are the questions you should answer about your business:
What is your revenue per technician?
What is your ratio of maintenance work to repair work?
What is your ratio of revenue delivered to revenue available?
A Closer Look at Key Metrics
Let’s take a closer look at each of these questions. Below, I’ve outlined some benchmark data from high performing companies and tips to improve performance for each.
Revenue Per Technician
Technician revenue will vary by specialty. Generally, we see the following annual averages among high performing companies:
Fire protection technicians (extinguisher): $200k/year
Fire protection technicians (sprinkler and alarm): $300k+/year
Mechanical service technicians: $400k/year – $500k/year
All too often, we find commercial service companies that want to improve their numbers but are fixated on too small of a piece of this equation – usually utilization of technician time.
To hit the $400k+ mark, you have to think bigger. How much are you charging the customer? Market leaders can charge more. Are you finding high margin work that doesn’t require as much labor? This includes repair work.
Let’s look at how you can maximize repair work opportunities.
Ratio of Maintenance Work to Repair Work
Tracking this metric shows you where opportunities for generating more revenue may be falling through the cracks. To increase repair revenue, you’ll need to track:
The number of deficiencies techs are reporting;
The number of those deficiencies that convert to quotes; and
Your approval rate on those quotes.
Our data shows that high performing companies convert at these rates:
Mechanical services: $1 of maintenance revenue to $4 of repair revenue
Fire protection: $1 of inspection revenue to $1 of repair revenue
For example, a fire protection company performing $5M in inspections should expect to generate an additional $5M in repair work from deficiencies found on those inspections. While a mechanical company performing $3M in inspections should expect to generate an additional $12M in repair work. Think about how that could impact your earnings.
Increasing Quote Volume
Giving your techs the ability to gather detailed information about deficiencies is a surefire way to increase quote volume. (To learn how one of our customers increased their quote volume by 50% using ServiceTrade, click here.) This means providing technicians with mobile applications so they can go beyond describing deficiencies to showing them – through photos and videos – which can be quickly communicated to your sales staff, who can turn them into quotes.
Increasing Quote Approval Rate
Your quote approval rate is determined by dividing the sum of approved quotes by the total number of quotes sent. For a more in-depth discussion on measuring quote approval, take a look at our previous post on the subject.
We talk to people all the time who say they have a 90% approval rate. But when we dig a little deeper and ask questions, we find they don’t actually know their approval rate. They’ve never measured it. On top of that, they send out a very low volume of cherry picked quotes. If your approval rate is in this range, take a closer look at how you are collecting the data.
Many factors improve quote approval rates, but the top 3 factors that we’ve found are:
Turn quotes around within 24 hours of finding the problem
Include rich media (photos, videos, audio) of the issue
By doing these three things, your online quote delivery process will earn a 3x approval rate over traditional quote delivery processes.
Ratio of Revenue Delivered to Revenue Available (Done versus Due Ratio)
Finally, you want to track your done versus due ratio. To calculate this number, divide revenue delivered (or work that is DONE – the amount of planned work completed and invoiced) by revenue available (or work that is DUE – the total amount of work authorized by maintenance contracts or approved quotes.)
Highly productive companies will generally have a ratio around 95-97%. Companies with low productivity will be closer to 75%. For a more in-depth discussion on this metric, read our earlier post on the subject.
Improving Done v. Due Ratio
The first step, and one we see many companies struggling with, is organizing and tracking this information in a manageable way. (Unless they are using ServiceTrade’s QuickSight capabilities.) But once you have a tracking system figured out, you can improve this ratio by prioritizing work related to higher margin contract maintenance, monitoring, inspection and planned repair revenue over unplanned service calls.
Setting Goals for the Next Quarter
Once you have determined your Q1 numbers, you can look to setting goals for Q2. For example, to set your goals for revenue per tech, break down your first quarter revenue by corporate division and by technician. How much revenue per day and how many jobs per day do your best techs drive? How do your best techs handle sending quotes?
Use performance of your best tech(s) as a goalpost for all techs. Once your techs start hitting that number, move it out. Your goal should be to increase revenue per technician 20% per year every year, or approximately 4.5%-5% per quarter.
Even if you don’t like the answers you find, you’ll feel more in control with a realistic snapshot of where you stand on these key questions. Schedule a recurring quarterly check-in on your calendar so that you can compare your performance quarter-to-quarter.
Interested in learning how ServiceTrade can track these metrics and improve your performance? Schedule a demo with us today.
5 Questions to Help Service Contractors Build More Valuable Businesses
Much of the popular culture in management consulting today is focused on the customer experience. Matt Dixon, the author of one of my favorite management books, The Challenger Sale, is spending many of his cycles promoting another of his books, The Effortless Experience. Shep Hyken is a customer service guru with a new book called The Convenience Revolution. And my latest book with Shawn Mims, Money For Nothing, focuses on the science behind making a customer feel good about their experience buying from commercial service contractors.
Yet even with all of this focus on customer experience, I still find that most service contractors remain firmly entrenched in a war to optimize the effort expended in their back office instead of directing their management attention to enhancing customer service. I have come up with a couple of questions that might help challenge that back office focus if the goal is to build a more valuable business.
Question 1: How easy is it to hire a new back office administrator versus hiring a new skilled technician?
This is an easy one, right? The answer is that hiring an administrator is very easy when compared to hiring a technician. Management’s focus should be on maximizing the productivity of each technician so that they deliver the maximum amount of revenue each day while simultaneously eliminating the risk a customer faces due to potential equipment failure. Your goal should be to increase revenue per technician 20% per year every year. Never yield in the pursuit of greater productivity for the technicians. Hiring administrators is easier, so transfer as much work as possible off the technicians and onto back office staff.
Question 2: How easy is it for your customer to review and approve a new quote?
If the answer is that they have to download an Excel file or PDF, print it, sign it, scan it, upload it, and email it back to you, that answer sucks. That is difficult. Not easy. Compare that level of effort with an online quote with pictures and video of the issue and a single button to push to “Approve” (or request changes) and provide a purchase order for billing purposes. Oh, and it never hurts that when the customer has viewed the quote online, the salesperson knows it has been viewed and can follow up to answer any questions. Don’t make it difficult for the customer to give you more money and remove risk from their environment by upgrading or repairing equipment (which is also good for you).
Question 3: Which is more valuable: eliminating all administrative overhead or showing an ability to sustain 20% revenue growth every year?
Again, it is an easy answer. Eliminating all of the administrative effort is worth perhaps 5 – 8% of revenue. Growth is MUCH more valuable if you can demonstrate you have a systematic way to sustain it due to your customer sales and service approach. If you ever intend to sell your business or bring on a new shareholder, focusing management effort and technology purchases on enhancing sales productivity is where you should spend your thought cycles and investment capital.
Question 4: How easy is it for you to show the customer the value of your work online?
Or do you just send them an invoice with a bunch of text and cryptic accounting codes to represent the value you deliver? If a customer has to wade through a detailed invoice, guess what is going to draw their eye? You got it, the numbers on the far right and in the bottom right corner. Guess what they are going to want to talk to you about? The value you delivered? Nope. “Why does it cost so much?” is the most popular question generated by an invoice.
Make it easy for them to see that value without digesting a cryptic invoice. It should be easy for them to see your work online in the form of service history for their equipment with photos, videos, risk assessments, quotes, etc. so that they see you are thoughtful and thorough in your approach to managing their important assets.
Question 5: How easy is it for your salespeople to show a new customer prospect how you are different?
Do you demonstrate the value of your unique approach to customer service? Pitching a value proposition of “we try harder” or “we care more” or “we are cheaper” sucks. It is much better to show the customer an online experience where they can conveniently review and engage with your company on ways to reduce risk and eliminate disruptions through a rich set of service history and equipment risk analysis.
If you cannot show prospective customers examples of this capability, what are you selling? Invoices? How do you expect to command a premium in the market compared to the low price competitor? Simple answer – don’t expect a premium and be prepared to compete on price.
I find all of these questions to be obvious indicators of where management should spend their effort – front office innovations that make customer service and revenue generation easier because the customer gets an effortless, or, better still, a feel good experience. So where are you spending your management effort? Front office and feel good? Or back office? Think about it.
The Data Gut Punch
January 14th marked the start of the AHR Expo in Atlanta at the 1.4-million sq. ft. Georgia World Congress Center. With 50-thousand attendees, that place was a madhouse. I, along with the rest of the ServiceTrade team, was engaged in back-to-back conversations with commercial mechanical service contractors about their growth goals. As we usually do, we made a lot of people very uncomfortable. How? By asking difficult questions and presenting hard data that shook long held beliefs about their businesses. It’s the moment you realize that you’re running your business blind based on gut instincts and then data comes along and knocks the wind right out of you. It hurts. Here’s an example from AHR:
Contractor: What does ServiceTrade do?
Me: ServiceTrade helps commercial service contractors be more valuable to their customers and grow their business.
Contractor: The only thing holding us back from growing are inefficiencies in the office and cost control hiccups. Can you help with that?
Me: We can definitely help there, but how much revenue do you drive per service technician per year?
[Long pause]
Contractor: I’ve never thought about that metric. Based on our total service revenue from last year and the number of techs we had on staff, we did great! We made about $200k per tech.
Me: Our mechanical customers drive $400k to $500k per service technician by focusing on customer service and repair opportunities, but we can talk about back office operations if you’d like.
[Crickets]
Examples like this are common, even among our own customers. We perform account health calls with our customers to compare their performance against a benchmark in their industry. Most are caught completely off guard by what they discover. They never bothered to look at their quote approval rate, they just assumed it was over 95%. They never checked their average days to invoice, they just assumed it was under 5 days. It reminds me of something our CEO always says:
Do you know what happens when you assume? You make an ass out of you and me.
Almost every contractor claims to be data driven. However, the reality is that most contractors are rarely collecting the data they need to make good decisions about how to grow. Sure, they can all tell you their margin across different divisions down to the penny, but you’ll rarely meet a contractor who is paying attention to growth metrics like the:
Ratio of PM/inspection to quoted revenue
Repair quote volume and quote approval rate
New contract sales opportunity and close rate
I’ve met far too many contractors that “just know” these metrics. No data to back them up, just pure instinct. Do you know these metrics for your business? Do you have good data to back them up? Check out ServiceTrade’s business analytics features.
Reals, not feels. That’s what you have to remind yourself every time you attempt to make a data-driven decision. As tempting as it is to rely on your gut and your feels to make decisions, the data and the reals don’t lie. Data doesn’t care about your opinion so don’t be surprised when the data disrupts your worldview and punches you in the gut. As much as it hurts, that’s a better outcome than trying to grow a company by feeling your way through the dark.
Here are a few more blog posts about metrics for service contractors that you might find interesting:
Every Sunday evening I receive an email from the software investment banking team at Key Bank Capital Markets. The subject line of the email is “Software Valuations,” and the email contains a link to a weekly report that details the valuation metrics of about 100 different software companies. All of these companies are public corporations, so their stock information is readily available for the folks at Key Bank to analyze. Most of the companies they follow are software as a service (SaaS) companies, and because ServiceTrade is a SaaS company, this report is very interesting to me as the CEO and a shareholder of ServiceTrade. It is my job to maximize the value of our stock for the benefit of all of our shareholders, and the Key Bank team helps me do this through their analysis of SaaS company valuations.
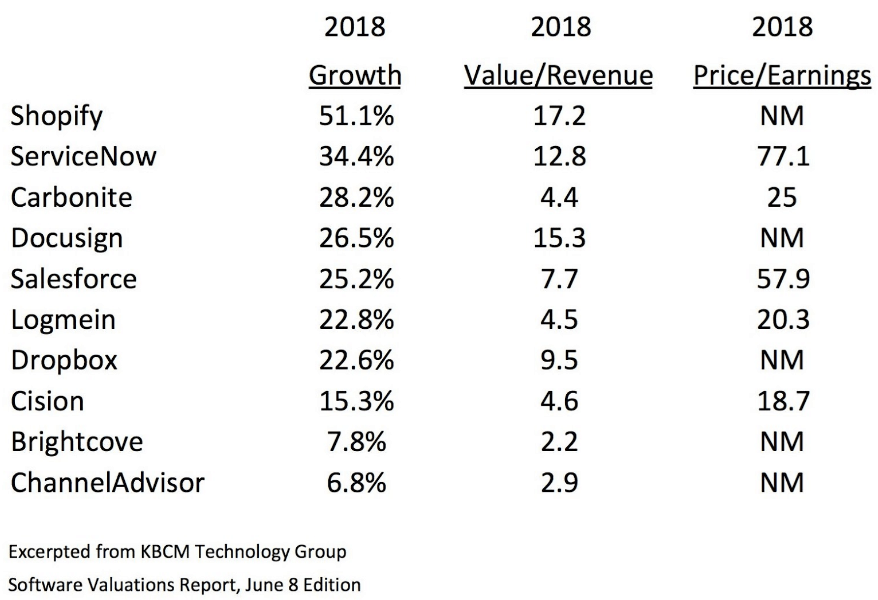
Here is an annotated version of a table they publish for about 70 different SaaS companies. I limited the table to 10 of the entries to make a point about the importance of growth to shareholder value.
I sorted these from high to low based on the value-to-revenue multiple. The value-to-revenue multiple indicates how much the total of each company’s outstanding stock is worth as a multiple of their anticipated 2018 revenue. The number-one performer is Shopify, with a value-to-revenue multiple of 17.2X. The total value of all outstanding Shopify stock is equal to 17.2 times the revenue expectation for Shopify in 2018. You are reading that correctly. Investors are willing to buy Shopify stock at an extraordinary premium because they believe Shopify is going to grow, grow, grow. And Shopify is delivering on that promise. Note that Shopify expects to grow revenue by 51.1 percent in 2018 compared to their revenue in 2017. That’s a terrific growth rate. Also note that Shopify has a value of NM (Not Measured because they are not making a profit) in the category of price-to-earnings. That’s because Shopify is going to lose money in 2018. They will probably also lose money in 2019 and 2020 because they are investing like crazy to continue to grow. Despite this lack of profit, their stock is still extremely valuable.
Contrast Shopify with ChannelAdvisor. Their stock trades for just 2.9 times the revenue expectation for 2018. It’s interesting that Shopify and ChannelAdvisor offer a similar value proposition with their software applications – they both help small merchants sell their products online. The biggest difference is that Shopify is expected to grow 51.1 percent in 2018 and ChannelAdvisor is expected to grow only 6.8 percent. The expectation of growth explains why Shopify is almost six times more valuable than ChannelAdvisor.
Why is any of this relevant to your business? It is very relevant because their business model is similar to yours in that they sell a subscription program to their customers. If you are following my advice and developing a subscription program for maintenance, monitoring, and inspections for which you sell an annual or longer contract, your business is similar to these companies, and investors will ultimately value your business in the same way they value these businesses. The point I am trying to make is that growing is better than grinding when it comes to creating value for shareholders.
Grinding means pushing everyone in the organization to squeeze more profit from the current revenue stream. I have nothing against profit, and I think you should aim to be profitable. But grinding does not significantly increase the value of your business if there is the possibility to grow the business instead.
Growing is much more fun for everyone than grinding, for all of the obvious reasons. Growing means that new stuff is happening all the time. New products are being introduced to the market. New customers are being served. New employees are joining the company to help take care of the new customers. New promotions are being handed out because there is more responsibility to be shared. New offices are being opened. New equipment is being purchased. New tools are being deployed. New training is underway on how to use new tools. New, new, new means fun, fun, fun.
Grinding sucks because old tools are breaking and not being replaced. Old employees are leaving and not being replaced or taking on more responsibility for no increase in pay. Old customers are complaining because they are not getting good service. Old trucks are breaking down and disrupting the workday. Old, old, old means suck, suck, suck.
What is your plan for growth? How are you going to orient your company in a direction that gets to the fun of growing? It begins with a commitment to growth. If there is no expectation in the company that growth is an important metric, then no growth will occur. Set growth targets as part of your planning process, and don’t be shy about asking people to stretch to achieve something ambitious. For organic growth, plan to grow by 10 percent per year, and think about pushing for 20 to 30 percent (depending on the size of your company). All the best employees in your business will rally around the growth goal because none of them signed on for a career in which not much was achieved. Your employees will get much more career development from an aggressive growth strategy.
Maximizing the value of your business is the most tangible outcome associated with a successful growth strategy. The difference in valuation of the companies tracked by Key Bank in the SaaS market based on their respective growth rates is extravagant, and it should be a lesson for anyone who wants to build value with a subscription business model. The intangible value of having a growth strategy is that you will attract, develop, and retain a better class of employees who value your company because they expect to experience greater career development. They will be exposed to ever-increasing levels of responsibility, which leads to higher job satisfaction and better retention. Growing is fun and grinding sucks, so aim for growth and get more pay and have more fun along the way.
Good is Not Good Enough
Amazon does not settle for “good” in the realm of customer service. It is not enough for the customer to simply get what they paid to receive. Amazon wants customers to enjoy the experience in the same manner as a guest might enjoy a good party. Great brands now want to copy Amazon because Jeff Bezos has become the wealthiest guy in the world due to the crazy success of Amazon stock. Smart business owners want the same value for their shareholders, so they are behaving like Amazon and aiming well beyond the idea of simply satisfying the customer. They truly want their customers to “feel good” about the experience of buying from them. This current obsession with the customer experience is certainly a good thing for customers. Because so many companies are now focusing on innovation in customer service, the bar for “feel good” status is climbing higher every day.
The most popular approach today for measuring customer satisfaction is the Net Promoter Score, or NPS. Wikipedia reports that more than two-thirds of the Fortune 1000 are currently using NPS. Here’s how it works.
Customers are asked a single, simple question:
How likely is it that you would recommend our company/product/service to a friend or colleague?
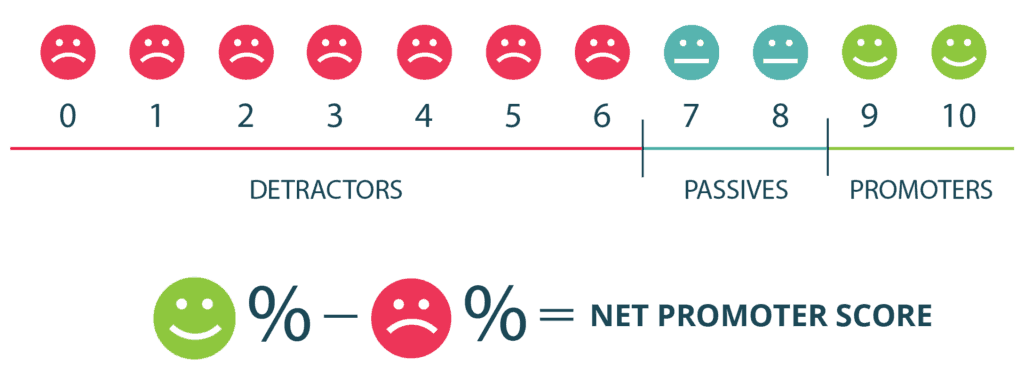
Respondents are then given an option to answer that question with a number rating on a scale between 0 and 10. 0 means that the customer would never recommend the company to a friend or colleague, and 10 means that they would absolutely recommend the company to a friend or colleague.
Next, respondents are categorized into the following groups: Promoters – those who score the business with a 9 or 10, likely to promote to others Passives- scored 7-8, not likely to benefit or harm your brand Detractors- scored 6 or less, a liability for your brand
The final NPS score is calculated by subtracting the percentage of Detractors from the percentage of Promoters, with the Passives not contributing at all to the score. As an example, if you were to survey 100 customers and 35 score as Detractors (0 to 6), 25 score as Passives (7 or 8), and 40 score as Promoters (9 or 10), your NPS score would be:
Promoters – Detractors = NPS 40 – 35 = 5
Your NPS for this survey sample is a 5. Anything above 0 is considered to be positive, and a score approaching 50 is terrific.
Now I think all of this is probably a little too simplistic, and you will find lots of scientific criticism for NPS from survey theory experts if you go looking for it online. My opinion and the opinion of all of the other critics is not what really matters in this case. What is important is that two-thirds of the Fortune 1000 are relying on this information in one form or another to help them improve customer satisfaction. A lot of big brands with big budgets are focusing lots of energy on measuring customer satisfaction. The other important thing to note is that this wildly popular tool skews heavily toward “feel good” as the goal for customer service. Only scores of 9 or 10 are credited positively, and anything less than a 7 is negative. I would say anyone that scores a company with a 9 or a 10 feels really good about their experience with the company. So two-thirds of the Fortune 1000 are scheming for ways to get more scores in the range of 9 to 10 because that is the only way to improve their NPS score. That’s a lot of companies with a lot of focus on making customers feel good about their brand.
What does this emphasis on outstanding customer service mean for you? Your business is going to be compared to all of the customer service innovations of Amazon and two-thirds of the Fortune 1000 because they are all “focused like a laser” on customer experience these days. NPS is hot because customer service innovations are hot because customer loyalty is hot because growth is hot because Amazon is hot. Customers are not going to compare you to your “always go low on price” competitor down the street any longer. They are going to ask “Why can’t you be more like Amazon and give me notifications when I am due for service or when the technician is en route to my location?” The customer service bar is going to be set by the sum of all of the best experiences the customer has ever encountered across all companies in both their personal and professional life.
The good news is that most customer service innovations can be observed and imitated if they fit your idea of great customer service for your company. The case of Amazon is particularly intriguing because up until a few years ago Amazon had absolutely no influence over the products customers were buying from them. They were simply a reseller of other companies’ products. Any innovation they delivered to make a customer feel good was not a product innovation but instead was focused solely on the buying experience. In my next post, I’ll discuss the “feel good” customer service themes direct from Amazon that should probably be among the guideposts you use in establishing your “feel good” customer service strategy.
AI, IoT, M2M, Big Data – The Alphabet Soup of Technology Jargon You Need to Understand (Part 1 of 2)
In 1984 I was seventeen years old and working as an usher in a movie theater when the science fiction thriller The Terminator was released. It was a surprise hit, and I must have seen the movie a couple of dozen times. In case you are not familiar with the movie, Arnold Schwarzenegger plays a human-like cyborg, a Terminator, sent from the future with a mission to kill Sarah Connor, the mother of the future resistance leader that is fighting the Terminator’s artificial intelligence master, Skynet. Aside from the obvious standout qualities of Schwarzenegger’s physique (a former Mr. Universe and Mr. Olympia) and the incredible strength demonstrated by the cyborg, the Terminator looks and even acts somewhat human. To remind the audience that the Terminator is actually a very sophisticated computer, director James Cameron sometimes displays the action from the perspective of the Terminator.
In these “look through” scenes, the audience is presented with a screen that is apparently the field of vision of the Terminator. The film color quality is replaced with mostly red, white and black imagery. Superimposed on the imagery is a bunch of scrolling text gibberish and some highlighted, flashing square boxes to call attention to certain data elements the Terminator may be analyzing – a person’s body size for suitable clothing, weapons in the hands of potential antagonists that must be foiled, etc. Of course, if the Terminator was really a sophisticated computer cyborg, there would not be an internal display barfing computer gibberish onto a screen in a manner that was readable by humans. Computers do not need human-readable text to operate on data the way humans need it. The computer would simply be ingesting external data via the cyborg’s camera eyes and his microphone ears along with any other external sensors for temperature, pressure, odor, and what not. Based on this observed data, the Terminator would be making judgments and taking actions that would have a high probability of creating a path to accomplish the mission – the termination of Sarah Connor. All of this would be happening without a human readable screen display.
Why am I talking about The Terminator? Why is the detail of the Terminator’s view of the world as depicted by the movie director important? I am talking about The Terminator to illustrate the point that artificial intelligence (AI), the Internet of things (IoT), big data, and all of the other alphabet soup puked up on a daily basis by technology media and vendors hyping their products is generally nothing more than the collective, gradual evolution of computers. In 1984, James Cameron could imagine a computer that understands and speaks natural language, sees real-time imagery, reacts to its environment, and takes actions to accomplish the mission. To portray the Terminator as a sophisticated AI being, Cameron showed the audience a visual model that generally represented what computers looked like to the masses in 1984 – a somewhat low-resolution screen with digitized text scrolling on it with an occasional selection option that would become highlighted if you tabbed a cursor to it (remember, the mouse was a new thing in 1984 as the first Apple MacIntosh computers just shipped that year). Cameron could not assume that the audience would make the leap to his futuristic interpretation of an AI-enabled cyborg, so he showed the audience a 1984 computer interface to make certain they got the connection. All this stuff in the media about AI, IoT, machine learning, big data, blah, blah, blah is just the real world catching up to what James Cameron predicted would happen way back in 1984.
Today we are talking to our phone to have it dial our best friend. We are issuing verbal commands to our Alexa assistant to have it order pizza or play our favorite music. Our Nest thermostat is monitoring our habits, such as when we come and go, along with our preferences for ambient temperature in order to take actions regarding raising and lowering the temperature where we live. These common applications of AI would have been totally foreign and inconceivable to a movie audience in 1984. But James Cameron had a vision of what artificial intelligence could potentially accomplish in the future, and he did a really good job presenting that vision to the audience in a way that they could understand it. Let’s do a quick reset on some over-hyped terms – AI, IoT, and big data.
Artificial Intelligence – AI is just the trend toward computers ingesting more diverse data in more formats (i.e. images, audio, natural language, pressure, temperature, humidity, etc.) to enable analysis that leads to judgments and actions related to accomplishing a mission or objective. Because AI is more of a trend than a definitive end-state, AI can simply be classified as Hofstadter, a famous AI scientist, describes it – “AI is whatever hasn’t been done yet.” More accurately, AI is simply the leading edge of new capability for computers to operate more intelligently on a broader diversity of data.
Internet of Things – IoT is simply a trend where more and more things are connected to the Internet to send or receive data or to act upon data received. Historically connections to the Internet were people staring at screens (and increasingly listening to audio speakers) and entering data or responding to data received. “Things,” whether a cyborg like the Terminator or a $10 temperature sensor, don’t need screens (nor keyboards or a mouse or speakers) to send and receive data or to act upon data received.
Big Data – Big Data is simply the collection and analysis of data sets that are too large for humans to effectively parse, analyze, and extract intelligence from using simple programs like Excel. Ever cheaper storage and computing cycles lead to ever-increasing data collection, storage, and analysis. Again, big data is simply a trend and not a definitive end state.
Over time, computers will progress to read a broader spectrum of inputs, make more sophisticated judgments, and take an increasing variety of actions that lead to desired outcomes. No one was talking about AI in 1984 – no one in the mainstream media anyway – because the topic was confined to a small group of computer nerds at top technical institutions like Stanford and MIT. Yet the director of The Terminator could imagine a future where a computer becomes so powerful that it can measure its environment in a humanlike manner, make judgments based upon those measurements, and take intelligent actions to execute a mission – in this case, the termination of Sarah Connor. It is unlikely that anyone who saw The Terminator in 1984 remembers the on-screen effects that Cameron used to connect the audience to the idea that the Terminator was a computer. I bet everyone who saw the movie remembers the Terminator’s mission, however. What was the mission? To terminate Sarah Connor of course.
Whether an innovation can correctly be labeled as AI (or with any other overhyped term of the day) is far less important than whether the innovation helps accomplish the mission. The Terminator’s mission was to terminate Sarah Connor, and the Terminator was extremely well suited for carrying out the mission (although it actually failed in this case). Defining the mission that you would like to accomplish with AI, IoT, big data, etc. is actually much more important, in my humble opinion, than the actual technology you select to achieve the mission. Have you thought about the mission that you want to accomplish using technology?
I believe the mission you are generally attempting to accomplish through technology is to maximize customer equipment performance while eliminating equipment failures so that your customer experiences the least risk, expense, and disruption in their business. The reason that technology is important as an enabler of this mission is because it is generally cheaper and easier to manage (sometimes) than people. If you accomplish this mission, your customer will spend zero dollars recovering from disruptions (lost output, spoiled inventory, damaged property, emergency services) while maximizing the amount of money they spend with you relative to other suppliers.
I will continue this topic next week with real-world examples of how AI, IoT, and big data are being used by service contractors today. I’ll also have some advice to make sure that what you’re building is more like a high-performing Terminator than a cobbled-together Frankenstein monster.
Two Ways for Contractors to Attract More Service Technician Job Applications
Your reputation has always been important when recruiting talent because the best techs want to work at the best companies. But the mediums job seekers use to search for potential employers has changed. Word of mouth is still around but pales in importance compared to your company’s online reputation. Before a job seeker even applies, your website, social media presence, and online reviews help them through the first two phases of the job hunt: Discovery and research.
1. Be Easy to Discover
When a technician starts their job hunt and isn’t familiar with all the local companies, where do you think they start? Google, of course. They’ll search for companies in their industry and the top results will be the first companies they research. That’s how Google has trained us all. The top search results are the best bet, and searching for local companies is no exception. Fortunately, the fresh, dynamic content created by your Digital Wrap is exactly the kind of indicator Google uses to rank websites. Just by performing the day-to-day tasks associated with the services you offer, your techs will be collecting customer reviews and generating rich content that will help prospective employees (and customers) discover your company.
Millennials, almost exclusively, find and research new job opportunities online. Most of my millennial friends discovered, researched, and applied for their current job completely online without talking to a single person. From discovery on Google or a job board to exhaustive research of prospective companies, they did everything on their laptop or smartphone. They browsed the company website and social media for information about the mission and culture. Where applicable, they researched customer reviews. They paid especially close attention to the reviews from current and past employees.
Indeed and Glassdoor, two of the largest job listing websites, are the dominant players when it comes to company reviews by former and current employees. When you Google a company by name, the employee rating of that company on Indeed or Glassdoor are often in the top results. Very quickly, a potential candidate can see what real employees think about a company. This can work for or against you. From a job seekers perspective, zero company reviews is concerning, a bunch of bad reviews is a death knell, and a mix of mostly good reviews is a great sign. I say a mix because people will be suspicious of your reviews if they are all five stars. Just like with your customers, it’s ok to ask your employees to leave a review of your company, just be sure that the review truly represents what they think, not what you think. Don’t instruct them to leave a good review and be responsive and respectful of any results you receive.
2. Be Easy to Research
If they find your company online, potential employees are going to look at your company website before they apply for a job. Is your website going to help recruit them? Does it have the information they ‘re looking for? Candidates aren’t just searching for a company that has an opening. They want to know about company culture and values. What do you stand for? They want to get a feel for what it’s like to work there. Is it fun? Is it challenging? They want to know what the opportunities for growth are. Will they advance their technical skill set or have an opportunity for advancement? They also want an easy application process. The bigger the barrier to applying, the fewer candidates you’ll receive. For example, a simple, mobile-friendly web form that collects their name and phone number with a call to action like “Are you a skilled technician and want to learn more about working at Aardvark Services?” will receive a lot more candidates than a Byzantine application process that asks candidates every possible question and requires them to upload a resume. You’ll definitely do more work to qualify candidates and get more that aren’t a fit but, in the midst of a skilled labor shortage, that’s an acceptable cost. Chances are, you’ll lose candidates you want before they even have a chance to apply if your application process is too difficult. Keep it simple.
Social media is a powerful tool when recruiting, especially Facebook and LinkedIn. When a candidate is considering a company, most will review the company’s social media profile and posts to learn about the brand. Compared to the corporate website, job seekers expect to find a candid representation of the company’s personality. Posts about company events, employees, and corporate values go a long way to help them get a better feel for the company.
It’d be nice if you could meet all of your hiring demand with a flood of great candidates that found you online, but that’s not going to happen for every company. Most likely, you’re going to have to get your hands dirty and actively recruit new employees. Armed with a reputable brand and a strong presence online, it will be easier. All you have to do is ask.
For entry-level office and field positions, one ServiceTrade customer Guardian Fire Protection has another interesting recruiting approach. Once a month, they host an open door interview day. Anyone who shows up is guaranteed an interview. Now, some interviews are MUCH shorter than others, but everyone gets a shot. They advertise the event through craigslist, social media, and through their website. For a relatively low investment of time and money, they’ve filled multiple open positions. When they ask successful candidates that show up on the interview day why they didn’t just apply online, candidates often say that they didn’t feel like their resume was good enough.
If potential employees don’t already know about your brand, your website and reviews should drive discovery through search engine optimization. Once they discover your brand, your online reputation should drive their research to the conclusion that you are a great company to work for and that they should apply. You can do a lot to help your recruiting efforts by making the discovery and research easier for job seekers. Want a big bonus? Being easy to discover and research will help out your potential customers, too.