


Field Service Reporting Software
Business Reporting
ServiceTrade field service reports help managers optimize field productivity and improve operational efficiency.
Get a Demo
Dashboards create a control center for managers to measure and monitor everything in their field service organizations.

Field service reporting simplifies the work of turning complex data into clear, actionable insights and facilitates better decision-making.

Performance data and trends hold your organization accountable to measurable goals.
Trusted by 1,300+ Happy Customers
See How Contractors Use ServiceTrade


Management Visibility
Field Service Reporting Software

Build field service reports and dashboards with charts, graphs, maps, pivot tables, lists, and more.
A large, complex service data set can be understood by employees who don’t have analytical experience when it’s summarized and shown in ways that everyone can read and understand.
Make big data analysis possible for anyone. The easy drag-and-drop interface in ServiceTrade’s field service reporting software makes it easy to analyze your customer service data.
Through further analysis, discover the business processes that could be optimized to improve results. Create new field service reports and dashboards to measure the impact of each operational change.

Start tracking the most common field service operations KPIs then expand your view over time.
Getting started isn’t difficult, ServiceTrade has a library of the industry’s commonly used reports to help you analyze your performance in standard field service KPIs.
Simple Pricing
Office users are always free. Our subscription pricing lines up with your most valuable asset – technicians.
Catch project management issues before they become cost and schedule overruns.
Learn MoreUnderstand how parts inventory and availability is impacting service operations.
Learn MoreConnect ServiceTrade with your accounting to augment insights gained from field service reports with financial reports.
Learn MoreFAQ
Looking for help with field service reporting software?
Field service reporting software allows field service technicians working at customer locations to report on the work they are doing. This type of field service management software usually has features that allow field techs to create work orders, record details of the work performed, track time spent on each job, and document any issues encountered. The field service software then shares this information with the business leaders so they know the status of open work, can track technician productivity, and generate reports on completed work. The goal is to provide better transparency and streamline communications between field service teams and office staff.
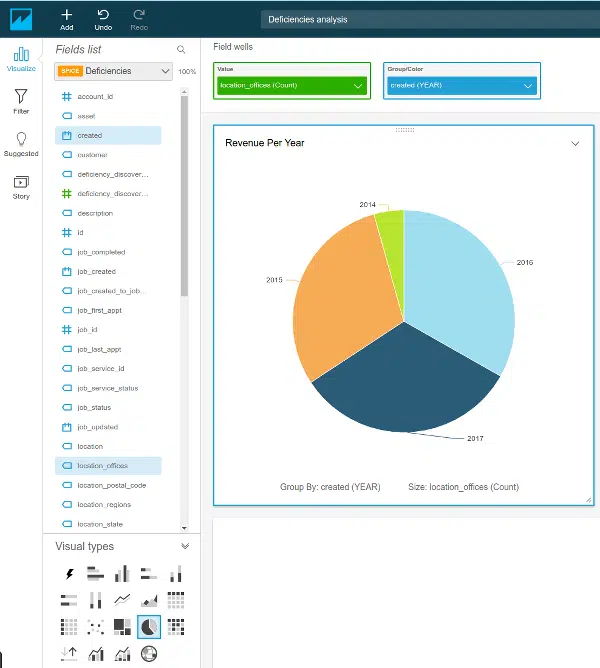
To create a field service report using ServiceTrade field service reporting software, you need to connect a business intelligence application like Amazon QuickSight to the ServiceTrade data warehouse. From there, you can access historical data to build visualizations and calculated fields to display and analyze key metrics from your field service data in custom reports.
Yes, one of the key features of ServiceTrade’s field service software is its ability to create custom reports. We wanted to make big data analysis possible for anyone, so we created field service management software with advanced features that with the drag-and-drop interface in QuickSight that makes it easy to create new field service reports to analyze your customer service data.
The Latest
Helpful Resources for Selecting Field Service Reporting Software
Get Started Today
See how ServiceTrade can give you control over your company’s operations.