Download the Report
Dive into the operational performance data that’s most relevant to your business.
Compare your:
- Revenue growth
- Jobs completed on time
- Days to Invoice
and more.

Data: Top performers grew YoY revenue by 30.1%.
Insight: Top performers grow 2.4x faster with better operations.
Best Practices: Prioritize value over volume. Schedule more proactive repairs. Accelerate cash flow.

Data: Top performers completed 84.8% of jobs on time.
Insight: Higher on-time completion rates were not correlated with higher revenue growth rates, indicating that completing more jobs on time is not a path to revenue growth. Prioritizing jobs with higher revenue potential on your schedule is a more impactful strategy.
Best Practices: Fully utilize your technicians. Prioritize work orders by revenue. Set and manage dollars per day goals.

Pull-through work includes repairs, upgrades, replacements, and installations that come from recorded repair opportunities.
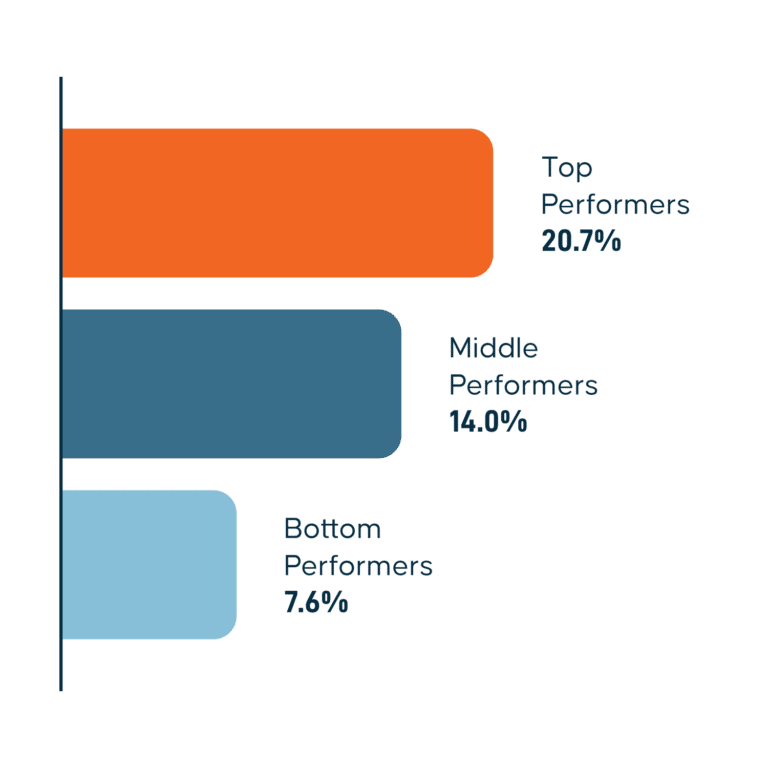
Data: For top performers, 20.7% of all work orders were pull-through in nature.
Insight: Pull-through work rate top-half performers grew 1.2x faster.
Best Practices: Find more deficiencies. Quote repairs faster. Make it easy for customers to approve quotes.

Data: Top performers invoice customers within 4.8 days.
Insight: YoY, commercial contractors are billing 20% slower.
Best Practices: Pre-bill when possible. Automate pricing contracts. Prioritize invoicing by revenue.
