Leveraging TechNOLOGY for Business Growth in Fire Protection
Billy Marshall explores how Fire Protection contractors can boost growth and productivity with technology in this recording of Off the Record with Paul Giannamore filmed at the NFPA Conference.
Billy Marshall, founder of ServiceTrade, understands the business of commercial service for fire protection equipment, which is why he founded Service Trade—a platform designed to help contractors streamline inspections, technician scheduling, and customer communications through a mobile app and tools like photo, video, and voice reporting.
He emphasizes data-driven scheduling—using “anchor jobs” in the first half of each month and reserving the rest for reactive work—to increase technician productivity and cash flow.Marshall also stresses the importance of offloading low-skill tasks and harnessing AI transcription to generate polished reports efficiently.
Looking ahead, he highlights trends like AI, RFID for equipment identification and remote panel activation, predicting steady tech-driven gains despite traditionally slow-moving code updates.
This session is about building a better business through technology. Watch now.
5 Moves Smart Contractors Are Making to Thrive in a Volatile Market
Commercial contractors are facing one of the most unpredictable economic landscapes in decades—tight labor, rising costs, interest rate shocks, and wavering capital spending. It’s easy to feel stuck. But top performers aren’t just weathering the storm—they’re growing.
At ServiceTrade, we monitor these industry trends and we see what’s working. The best contractors are doubling down on operational excellence, recurring revenue, and smart technology. Here are 5 powerful strategies that are helping them grow margins, retain talent, and boost valuation right now:
1. Streamline Operations to Protect Margins
Improve efficiency from quote to invoice—your fastest path to higher profits.
With the rise of AI and IoT, predictive maintenance is transforming commercial building services. Contractors who digitize workflows and prioritize scheduled service over emergency calls are building more profitable, predictable businesses.
Actions that drive impact:
Avoid fixed-fee quotes. Use cost-plus pricing to protect margins from supply chain volatility.
Prioritize preventive maintenance. Reduce the chaos and overhead of reactive work.
Track key performance metrics. Monitor KPIs like revenue per technician and gross profit per hour to optimize each hour of technician time.
2. Turn Compliance and Cost Control Into Recurring Revenue
Become a strategic partner, not just a vendor.
Building owners and operators need help navigating compliance mandates, aging systems, and energy costs. Contractors who position themselves as strategic partners—rather than transactional vendors—build long-term relationships and predictable income.
Strategies to win the right work:
Stay away from capital-dependent construction or break/fix work. Construction is too risky in a tight money environment, and break/fix work is administratively expensive and disruptive.
Secure recurring equipment inspection agreements. Then optimize your repair pull-through process.
Show, don’t just tell. Use photos and videos to communicate service value, not just invoice totals.
3. Boost Valuation with Efficiency and Recurring Revenue
Buyers love predictable profits—and efficiency sells.
M&A activity is surging. Companies commanding premium valuations have this in common: high-margin recurring revenue, strong EBITDA, and technology-enabled operations. A Charter Capital Partners Q4 report found that the mean EBITDA for field services company acquisitions was 13%. In short, companies with strong recurring revenue streams and compliance-driven services can command the highest valuations.
Steps to command a premium:
Focus on your best customers. Profitability—not volume—builds value.
Implement field efficiency software. Companies using operations software, such as ServiceTrade, see up to 25% performance gains in year one.
Use technology to strengthen customer relationships. Combine proactive, reliable scheduling with detailed and actionable customer communication about service work.
4. Use Data to Drive Every Decision
Top contractors turn performance data into growth strategies.
The best-performing commercial service contractors use data to power technician productivity and business growth. Integrated software enables them to prioritize high-value jobs, close work orders faster, and unlock new revenue through proactive repairs.
Metrics that matter:
Manage revenue per technician. Use dollars-per-day goals to optimize scheduling and prioritize work.
Improve cash flow. Accelerate invoice cycles by connecting contracts, work orders, and completions.
Increase repair conversions. Top performers quote faster and convert 20% of work orders into additional revenue.
5. Win the Labor Challenge with Technology and Career Pathways
Enable technicians to do more of what they’re best at.
A 14–20% skilled labor shortfall is colliding with 6–8% industry growth. Contractors who simplify technician workflows and invest in people will outpace those who don’t. It’s no longer just about hiring—it’s about enabling and retaining a skilled workforce that can deliver against profitability goals while serving customers and selling more business.
Workforce strategies that pay off:
Cut the admin burden. Let technicians focus on what they do best—service and repair.
Equip techs with job-critical info on their mobile devices. Fewer mistakes. Faster jobs. Less rework.
Serve your best customers first. Prioritize value over volume and reduce costly “windshield time.”
The Path Forward
Contractors who embrace speed, data, and smarter workflows are poised to win—today and tomorrow. Whether it’s boosting revenue, retaining great talent, or attracting buyers, the most resilient companies are building their advantage now.
At ServiceTrade, we’re proud to help power that success.
How to Grow Your Service Contracting Revenue 23.4% Year Over Year
On average, commercial service contractors who use ServiceTrade grow their invoice revenue by 23.4% year over year. All you have to do is buy ServiceTrade and you’ll grow! Our work here is done. The end.
If only it were that simple. There is a big difference between the best and worst performers. For example, contractors that engage their customers online, quote more repair work, and drive more revenue per customer and per job grow much faster than those that don’t.
These conclusions came from an analysis of millions of data points. Over the last year, ServiceTrade customers invoiced over $1 billion through 1.5 million invoices on 1.9 million jobs. On top of that, their customers approved 140,000 quotes to the tune of $450 million. That’s a shedload of service work! We measured YoY revenue growth for companies generating invoices in ServiceTrade since 2017Q2 and here’s what we found:
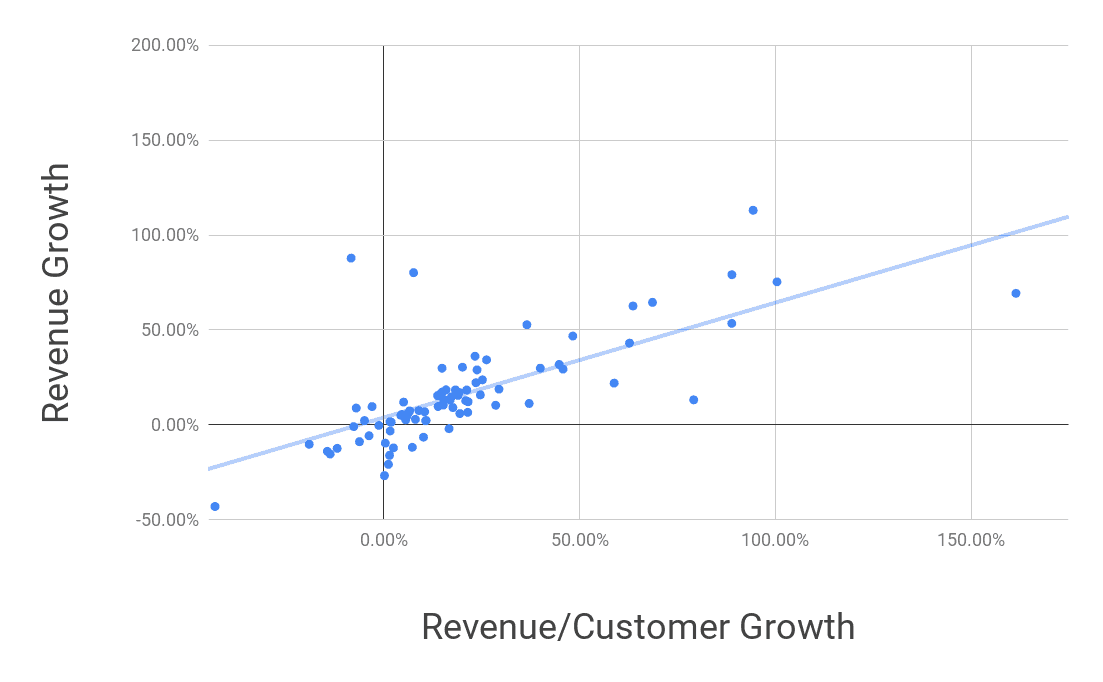
Drive more revenue per customer and per job to yield faster growth
We wanted to know where the fastest growing contractors earn their new revenue. As it turns out, the old business adage that it’s easier to drive more revenue from your existing customer base than from acquiring new customers is true even for service contractors.
We found that a company’s growth rate is proportional to how quickly they grow the average revenue per customer (chart) and revenue per job (chart). Surprisingly, a company’s ability to attain net new customers does not impact revenue growth. In fact, some of the fastest growing companies have a shrinking customer count because they fire lots of their worst customers and win a smaller group of new customers that represent more revenue.
So, how are you going to drive more revenue from the work you already have? Read on!
Engage customers online to create revenue growth
We divided ServiceTrade customers in half based on how often their customers engage with Service Links*. The top half, whose customers viewed Service Links more often, grew their service revenue an average of 29.1% YoY. The bottom half only grew 9.2% YoY. Your customers want to trust that they are getting the value they are paying for. If you provide more transparency with a convenient, online experience, you build that trust and differentiate yourself from your competition. Being different and better makes it easier to command a premium price and earn more revenue from each customer.
*With ServiceTrade, you send online summaries of the services you are performing with a feature called Service Link. Here’s an example. Much like the notifications you receive for every Amazon order about shipping, delivery, and feedback, Service Link keeps your customers informed about the value you deliver on each service. We call these Marketing Impressions Per Service (MIPS) and they reinforce your value while keeping your customers informed about the service process.
Sell more repair work
Then we divided our customers based on a ratio of the number of approved repair quotes to overall job count — how often are they earning new repair revenue for each completed job? The top half grew their revenue at an average rate of 27.7% YoY. The bottom half only grew 10.8%.
Sending online quotes to your customers that are easy to approve and include details, pictures, and videos reported from the field is quick and easy with ServiceTrade. And, as I showed in my last data-driven blog post, quotes that are sent quickly, that include rich media, and are convenient for the customer have much higher approval rates.
At the beginning of this post I joked that all you have to do is buy ServiceTrade to grow. The fact is, when used effectively, ServiceTrade is a powerful tool to help you drive more revenue from the customers you already have. ServiceTrade will help you grow by engaging your customers online and executing more effectively on repair sales.
The data analysis and graphs for this blog post were all generated with Amazon QuickSight that is available to ServiceTrade customers to analyze their own service data. Call us at 919-246-9900 if you’d like to learn more.
The Economic Downturn is Coming. Are You Ready for Greedy Growth?
Trade wars have sent steel prices up twenty five percent and farmers are getting killed by the collapse of the agricultural commodities market. Job growth slowed to a paltry 75,000 in May, and the two prior months of April and March were revised downward by 75,000. The European Central Bank is already easing monetary policy and hinting at future stimulus measures to fend off weakness in the Eurozone economy. Jerome Powell, the head of the US central bank, just telegraphed a rate cut. Brexit is a mess with all manner of political and economic uncertainty driving the UK economy into a contraction. Chinese investors are pulling out of the US real estate market due to retaliatory regulations associated with the trade wars.
A downturn in the economy is coming. It always comes, and the signs are everywhere that the happy days are close to an end. When the easy-money construction market dries up, will your contracting business still be poised for profitable growth? Will you be ready to take advantage of your weak competitors? Or will you be one of the weaklings that struggles to keep the wheels on the bus as competitors sharpen their knives in the battle for the stability of a highly profitable service business?
Warren Buffet is fond of saying “When others are greedy, be fearful. When others are fearful, be greedy.” What steps should you take to exercise fear now and be greedy when the downturn comes? Here are some ideas to prepare for greedy growth during the downturn.
Lock In Service Contracts Now
The last thing you want during the downturn is for your best customers to be shopping for service or responding to the desperate sales pitch of the low price competitor who is getting killed in the downturn (and hence getting more desperate and lowering prices even further). Customers can always breach a contract, but most will not want to do that, or they will simply ask for some consideration (payment terms, maybe a slight rate cut) in a down economy. Get on the right side of this negotiation now by offering a good contract that commits you to the services that will keep their facilities in top shape during the boom times when others are out chasing new construction opportunities.
Optimize Website SEO with Reviews
When the weak competitors begin to go belly up, or more likely they fail to make payroll and their technicians begin looking for the next opportunity, you want your company to be the number one hit (and number two and three and four as well) on the search engines. The downturn is prime-time to lock in new technicians who discover their employer is a weak player. They will be looking online. Will they find you? They will if you have your online reviews juicing your SEO results.
Get Your Careers Page Looking Spiffy
Hiring is difficult, but it is even harder when no one knows what types of positions you are offering. Always list openings for skilled technicians on a careers page on your website. Be specific about the skills that you value and the unique capabilities of your company, including any special technology capabilities that you deploy in service to your customers. Being specific about these things is better than simply declaring your company is better because you work harder, care more, been around longer, love mom and apple pie and blah blah blah.
Upgrade Your Customer Service Technology
When competitors begin their desperate attempt to keep customers at all costs, you want to be the one that has the most leverage in the fight for keeping the best customers. If you have put in place systems that help you understand customer contract performance, equipment maintenance condition, and technician productivity and revenue performance, you will be in the best negotiating position possible.
You will be able to reward good customers that follow maintenance protocols and repair recommendations with better rates while letting the customers with a history of poor maintenance and disruptive emergency calls fall to the competitor. Let them have the aggravation and low rates for these customers.
You will also be able to provide more competitive rates when you can use technology to maximize technician productivity and minimize wasted unbillable time. If you can increase their billable productive time by 10%, you can lower rates by 10% if necessary to keep the good customers from making a mistake and switching to Desperate Don.
Offer Customers Unique Capability and Insights
Although this is a capability that should be part of your customer service technology upgrade, it is worth mentioning as a separate item. In a world of Amazon and Uber, customers will expect their suppliers to give them more than just the labor and parts they bargained to buy. They expect information and insights as part of the customer service experience, and they expect them to be delivered online.
Challenge the customer that is about to make a mistake by switching to Desperate Don to make Don prove that he can provide the unique, information based and convenient experience that comes with your service. If the customer works with Don, can they:
See evidence of the work performed online?
Review and approve quotes online?
Review equipment service and repair history online?
Request service online?
See the progress of the technician online as he executes the maintenance routine on a complex site?
Maybe they will turn Don’s desperate offer down when he cannot provide any of this customer experience value.
Are you ready to be greedy when others become fearful? The key is having the confidence that you are operating with the best information to provide the best experience with maximum technician productivity so that you can aggressively hire and sell. When you know that the sale is going to stick and technician productivity is going to be high, you can hire and sell and hire and sell when others are struggling and become tired as hell of trying to figure out how you do what you do. Let’s hope the downturn is soon so the best competitors can wipe the floor and benefit from some greedy growth.
Service Contractors: Grow like a software startup
Every Sunday evening I receive an email from the software investment banking team at Key Bank Capital Markets. The subject line of the email is “Software Valuations,” and the email contains a link to a weekly report that details the valuation metrics of about 100 different software companies. All of these companies are public corporations, so their stock information is readily available for the folks at Key Bank to analyze. Most of the companies they follow are software as a service (SaaS) companies, and because ServiceTrade is a SaaS company, this report is very interesting to me as the CEO and a shareholder of ServiceTrade. It is my job to maximize the value of our stock for the benefit of all of our shareholders, and the Key Bank team helps me do this through their analysis of SaaS company valuations.
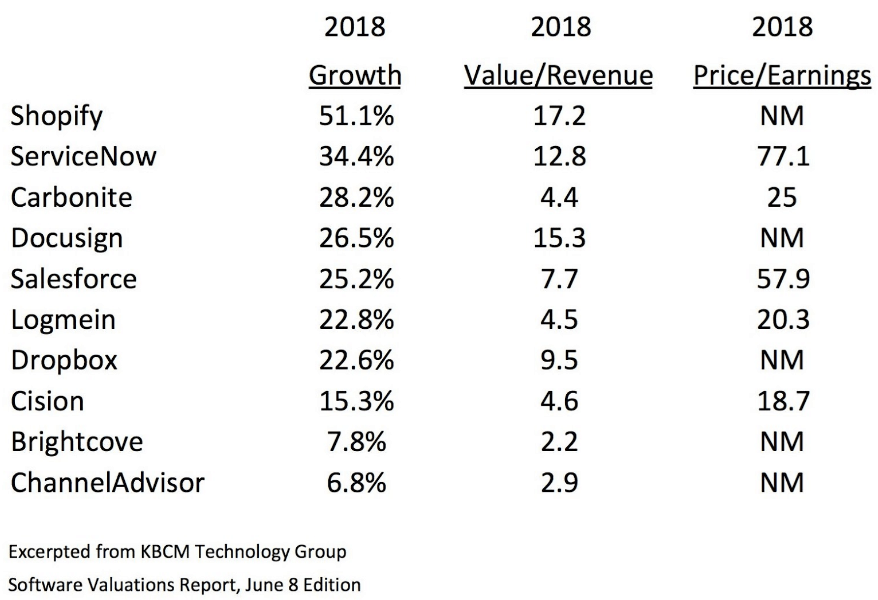
Here is an annotated version of a table they publish for about 70 different SaaS companies. I limited the table to 10 of the entries to make a point about the importance of growth to shareholder value.
I sorted these from high to low based on the value-to-revenue multiple. The value-to-revenue multiple indicates how much the total of each company’s outstanding stock is worth as a multiple of their anticipated 2018 revenue. The number-one performer is Shopify, with a value-to-revenue multiple of 17.2X. The total value of all outstanding Shopify stock is equal to 17.2 times the revenue expectation for Shopify in 2018. You are reading that correctly. Investors are willing to buy Shopify stock at an extraordinary premium because they believe Shopify is going to grow, grow, grow. And Shopify is delivering on that promise. Note that Shopify expects to grow revenue by 51.1 percent in 2018 compared to their revenue in 2017. That’s a terrific growth rate. Also note that Shopify has a value of NM (Not Measured because they are not making a profit) in the category of price-to-earnings. That’s because Shopify is going to lose money in 2018. They will probably also lose money in 2019 and 2020 because they are investing like crazy to continue to grow. Despite this lack of profit, their stock is still extremely valuable.
Contrast Shopify with ChannelAdvisor. Their stock trades for just 2.9 times the revenue expectation for 2018. It’s interesting that Shopify and ChannelAdvisor offer a similar value proposition with their software applications – they both help small merchants sell their products online. The biggest difference is that Shopify is expected to grow 51.1 percent in 2018 and ChannelAdvisor is expected to grow only 6.8 percent. The expectation of growth explains why Shopify is almost six times more valuable than ChannelAdvisor.
Why is any of this relevant to your business? It is very relevant because their business model is similar to yours in that they sell a subscription program to their customers. If you are following my advice and developing a subscription program for maintenance, monitoring, and inspections for which you sell an annual or longer contract, your business is similar to these companies, and investors will ultimately value your business in the same way they value these businesses. The point I am trying to make is that growing is better than grinding when it comes to creating value for shareholders.
Grinding means pushing everyone in the organization to squeeze more profit from the current revenue stream. I have nothing against profit, and I think you should aim to be profitable. But grinding does not significantly increase the value of your business if there is the possibility to grow the business instead.
Growing is much more fun for everyone than grinding, for all of the obvious reasons. Growing means that new stuff is happening all the time. New products are being introduced to the market. New customers are being served. New employees are joining the company to help take care of the new customers. New promotions are being handed out because there is more responsibility to be shared. New offices are being opened. New equipment is being purchased. New tools are being deployed. New training is underway on how to use new tools. New, new, new means fun, fun, fun.
Grinding sucks because old tools are breaking and not being replaced. Old employees are leaving and not being replaced or taking on more responsibility for no increase in pay. Old customers are complaining because they are not getting good service. Old trucks are breaking down and disrupting the workday. Old, old, old means suck, suck, suck.
What is your plan for growth? How are you going to orient your company in a direction that gets to the fun of growing? It begins with a commitment to growth. If there is no expectation in the company that growth is an important metric, then no growth will occur. Set growth targets as part of your planning process, and don’t be shy about asking people to stretch to achieve something ambitious. For organic growth, plan to grow by 10 percent per year, and think about pushing for 20 to 30 percent (depending on the size of your company). All the best employees in your business will rally around the growth goal because none of them signed on for a career in which not much was achieved. Your employees will get much more career development from an aggressive growth strategy.
Maximizing the value of your business is the most tangible outcome associated with a successful growth strategy. The difference in valuation of the companies tracked by Key Bank in the SaaS market based on their respective growth rates is extravagant, and it should be a lesson for anyone who wants to build value with a subscription business model. The intangible value of having a growth strategy is that you will attract, develop, and retain a better class of employees who value your company because they expect to experience greater career development. They will be exposed to ever-increasing levels of responsibility, which leads to higher job satisfaction and better retention. Growing is fun and grinding sucks, so aim for growth and get more pay and have more fun along the way.
Good is Not Good Enough
Amazon does not settle for “good” in the realm of customer service. It is not enough for the customer to simply get what they paid to receive. Amazon wants customers to enjoy the experience in the same manner as a guest might enjoy a good party. Great brands now want to copy Amazon because Jeff Bezos has become the wealthiest guy in the world due to the crazy success of Amazon stock. Smart business owners want the same value for their shareholders, so they are behaving like Amazon and aiming well beyond the idea of simply satisfying the customer. They truly want their customers to “feel good” about the experience of buying from them. This current obsession with the customer experience is certainly a good thing for customers. Because so many companies are now focusing on innovation in customer service, the bar for “feel good” status is climbing higher every day.
The most popular approach today for measuring customer satisfaction is the Net Promoter Score, or NPS. Wikipedia reports that more than two-thirds of the Fortune 1000 are currently using NPS. Here’s how it works.
Customers are asked a single, simple question:
How likely is it that you would recommend our company/product/service to a friend or colleague?
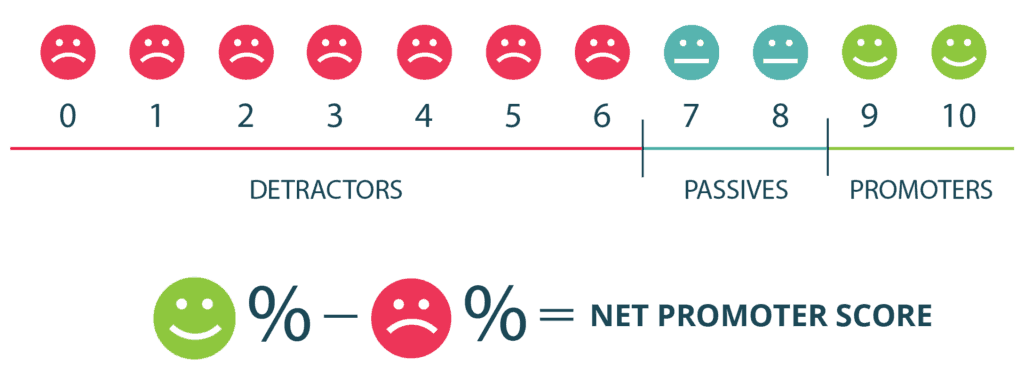
Respondents are then given an option to answer that question with a number rating on a scale between 0 and 10. 0 means that the customer would never recommend the company to a friend or colleague, and 10 means that they would absolutely recommend the company to a friend or colleague.
Next, respondents are categorized into the following groups: Promoters – those who score the business with a 9 or 10, likely to promote to others Passives- scored 7-8, not likely to benefit or harm your brand Detractors- scored 6 or less, a liability for your brand
The final NPS score is calculated by subtracting the percentage of Detractors from the percentage of Promoters, with the Passives not contributing at all to the score. As an example, if you were to survey 100 customers and 35 score as Detractors (0 to 6), 25 score as Passives (7 or 8), and 40 score as Promoters (9 or 10), your NPS score would be:
Promoters – Detractors = NPS 40 – 35 = 5
Your NPS for this survey sample is a 5. Anything above 0 is considered to be positive, and a score approaching 50 is terrific.
Now I think all of this is probably a little too simplistic, and you will find lots of scientific criticism for NPS from survey theory experts if you go looking for it online. My opinion and the opinion of all of the other critics is not what really matters in this case. What is important is that two-thirds of the Fortune 1000 are relying on this information in one form or another to help them improve customer satisfaction. A lot of big brands with big budgets are focusing lots of energy on measuring customer satisfaction. The other important thing to note is that this wildly popular tool skews heavily toward “feel good” as the goal for customer service. Only scores of 9 or 10 are credited positively, and anything less than a 7 is negative. I would say anyone that scores a company with a 9 or a 10 feels really good about their experience with the company. So two-thirds of the Fortune 1000 are scheming for ways to get more scores in the range of 9 to 10 because that is the only way to improve their NPS score. That’s a lot of companies with a lot of focus on making customers feel good about their brand.
What does this emphasis on outstanding customer service mean for you? Your business is going to be compared to all of the customer service innovations of Amazon and two-thirds of the Fortune 1000 because they are all “focused like a laser” on customer experience these days. NPS is hot because customer service innovations are hot because customer loyalty is hot because growth is hot because Amazon is hot. Customers are not going to compare you to your “always go low on price” competitor down the street any longer. They are going to ask “Why can’t you be more like Amazon and give me notifications when I am due for service or when the technician is en route to my location?” The customer service bar is going to be set by the sum of all of the best experiences the customer has ever encountered across all companies in both their personal and professional life.
The good news is that most customer service innovations can be observed and imitated if they fit your idea of great customer service for your company. The case of Amazon is particularly intriguing because up until a few years ago Amazon had absolutely no influence over the products customers were buying from them. They were simply a reseller of other companies’ products. Any innovation they delivered to make a customer feel good was not a product innovation but instead was focused solely on the buying experience. In my next post, I’ll discuss the “feel good” customer service themes direct from Amazon that should probably be among the guideposts you use in establishing your “feel good” customer service strategy.
One day you will want to have some outsider set a value for your business as part of an exit strategy or for the purpose of passing the business to a new generation. What management metrics will you use to guide your efforts during the many years leading up to that valuation day? How can you deliver steady, market-beating results that are not affected by the various dips and swings that you inevitably experience while serving your customers? The key is to find a strategy that minimizes volatility and maximizes consistency over a long period. You need to deliver for real what Bernie Madoff falsely projected in order to impress the investors that will ultimately value your business.
Revenue and gross margin are not perfect measurements for management success, so what are the measurements that matter? How can the owners of the business look back at the past month or quarter and make a judgment regarding success or failure? If the business is an investment, it should be measured like an investment, and the investments that people value most highly are those that deliver predictable returns over and over again. Bernie Madoff famously played on this investor bias by cooking the books to show steady and consistent returns, no matter what the market conditions, in order to lure more investors to his Ponzi scheme. Investors will always pay a premium for an investment with steady and consistent returns. So what are you going to measure to be certain you are optimizing for consistent and predictable returns?
Your service contracting business, just like an investment firm, faces uncertain market conditions. Instead of swings in the Dow Jones Industrial Average, the S&P 500, and the NASDAQ, you are dealing with cold weather, hot weather, fuel price fluctuations, tight labor markets, and swings in customer buying sentiment brought about by the same economic indicators that affect Wall Street. In the face of all of these potential distractions, you need a simple and effective formula to focus your team on the long-term measurements that matter so that they can more effectively navigate a path through the potential chaos. I have a simple, easy to remember measuring stick to help you focus your management team on the outcomes that maximize shareholder value, but before I reveal it, see how you do in answering these questions:
How many customers do you have under an annual or longer maintenance contract?
What is the monthly recurring revenue (MRR) or annual recurring revenue (ARR) for these contract customers? This is the predictable maintenance, monitoring, and inspection revenue that always shows up on the income statement regardless of market conditions.
What is the total contract value (TCV) of future committed revenue for maintenance, monitoring, and inspections for all customers under contract? Are your customers signing two-, three-, and four-year commitments to you?
How many customers pay you in advance for your maintenance program? What is the amount of deferred revenue on the balance sheet? A higher amount of deferred revenue means that customers are paying you in advance for your services. Paying in advance means they are more committed to your services and your contract. It also means you can use that cash to fund sales to new customers.
What is the ratio of planned service revenue (maintenance, inspections, quoted repairs) to unplanned service revenue (emergency service calls where something broke)? Higher ratios mean better customer service, and better customer service means customers will stick with your company for a longer term. Customers do not like unplanned expenses nor the disruptions they represent.
What is the net revenue churn in the customer base? How much revenue did you earn this year from customers that have been with you for over a year relative to the revenue from those same customers for the prior year? Ideally, this ratio is 90% or even higher. Minimal account churn means your digital wrap is sticky.
What is your contract renewal rate? What percentage of customers do not renew their maintenance plan when it comes due? How much annual contract revenue on average do these non-renewing customers represent? These numbers represent your gross churn, and ideally, gross churn should be less than 10%.
All of these questions are directly correlated with the value of a service contracting business (or any subscription or maintenance oriented business for that matter), and not one of them deals directly with the question of gross margin for service calls. Service call gross margin is important, but gross margin on contract maintenance, monitoring, inspections, and planned repairs is actually much more important. Predictable growth is even more important. No investor will complain about an occasional expense hiccup for unplanned services in the context of a highly predictable, growing stream of high margin, contract service fees. The very nature of unplanned repair work (it is unplanned!) makes it volatile and not particularly valuable to an investor, so optimizing gross margin on this work is the least of your concerns. Try to eliminate these disruptive emergency service calls altogether if you can.
I recognize that many of the questions above are kind of technical and difficult to absorb until you get into the swing of these measurements. It comes down to three simple questions to ask over and over again:
How Many? How Much? How Long?
How many customers you have? How much you earn from them? And how long you keep them?
These three questions that we’ve been talking about underpin the basic value-building fundamentals for almost any business. Read more about How Many? How Much? How Long? value calculations here.
Fraud Doesn’t Pay, But Consistent Results are Worth Billions
Bernie Madoff was arrested in 2008 for running what is believed to be the largest Ponzi scheme ever. Over a period of more than twenty years, Madoff had convinced wealthy, high profile private clients like Steven Spielberg and the Wilpon family (owners of the New York Mets) along with sophisticated commercial clients like MassMutual, Banco Santander, and HSBC to entrust their money to his firm. The reason these folks went along with the scam is not because Madoff delivered eye-popping results with a brilliant strategy. He was not like John Paulson, who famously made over four billion dollars personally in a period of less than twelve months by using credit default swaps to bet against the subprime mortgage lending market. Madoff drew high profile clients and sophisticated financial firms into his orbit by falsely projecting modest but consistent returns. Over a period of 174 months (just longer than fourteen years), Madoff reported results that were only modestly better than the return of the Standard and Poor’s index, but over that very long horizon, he only reported a monthly loss seven times. This extraordinary consistency led several financial forensics investigators to question Madoff’s legitimacy, but the allure of consistent, albeit modest, positive returns was a powerful magnet for investors. They all turned a blind eye to the fraud while funneling enormous sums of money to Bernie.
The lesson for the service contractor is not that fraud is a good road; Bernie is serving a 150-year sentence for his crimes and the related $17.5 billion in losses he cost his clients. The lesson for the service contractor is that predictable, steady growth over a long period of time is an irresistible attraction for sophisticated investors. One day you will want to have some outsider set a value for your business as part of an exit strategy or for the purpose of passing the business to a new generation. What management metrics will you use to guide your efforts during the many years leading up to that valuation day? How can you deliver steady, market-beating results that are not affected by the various dips and swings that you inevitably experience while serving your customers? The key is to find a strategy that minimizes volatility and maximizes consistency over a long period. You need to deliver for real what Bernie falsely projected in order to impress the investors that will ultimately value your business.
In an earlier blog post about Red Hat, I described the efforts that Red Hat undertook to avoid being labeled as a company that provided “break-fix” support for technical issues associated with Linux technology. The directors at Red Hat were savvy investors, and they understood that a volatile “break-fix” revenue model was far less valuable than a consistent subscription model. During my time with DunnWell, the service contracting company that preceded ServiceTrade, I witnessed firsthand the difficulty of delivering steady, predictable income performance when the mix of services leans too heavily towards a “break-fix” model. One particular management meeting stands out in my mind. It was a March meeting to review the February results, and the tension between the steady, predictable outcomes of maintenance work as compared to the more volatile “break-fix” type work became vividly clear.
February temperatures that year had been brutally cold throughout much of the country, and lots of sprinkler pipes had frozen at our customers’ locations, even in the southern states. The emergency revenue was very high for that February as we responded to so many frozen pipe situations. The maintenance and planned repair revenue, however, was somewhat lower than expected, but the total revenue exceeded our target by about fifteen percent based upon the strength of the emergency service calls. The gross margins were OK, but not what you would expect when you have much higher revenue to absorb the delivery costs. “Shouldn’t the margins be higher since we charge more for emergency work?” I naively asked. “Nope,” replied Sean McLaughlin, the head of operations. “We have to pay an arm and a leg to get people to respond to these emergency calls on a bitterly cold winter night. It is always a scramble. Costs are higher, and the administrative burden is also higher because you have to constantly field calls from the customers and then call them back with updates.” Looking at the numbers I guessed “So the maintenance revenue is lower because our people were focused on chasing down problems instead of staying on top of the planned work?” Sean snorted “That MIT education is paying real dividends for you right now, isn’t it?”
During a typical month, DunnWell would deliver between 92 – 96% of the planned maintenance, inspection, and repair work that was available under contract. We called this measurement the “due versus done” ratio. It represented the amount of work delivered and invoiced divided by the total amount which customers had authorized, either via a maintenance contract or an approved repair quote. To be strictly correct, it should have been called the “done versus due” ratio, but it was named before I got there, and “due versus done” had a better ring to it. That cold February, the “due versus done” ratio sagged downward to about 80%.
When the metric lagged, Joe Dunn, the largest shareholder in DunnWell, would remind everyone that “the customer has written a check and laid it on the counter, and we couldn’t be bothered to show up and cash it.” Put in those terms, it seems pretty silly to let anything get in the way of cashing a check, but it was surprising how often people with good intentions could become distracted by chaos and neglect to pick up those checks. The distractions typically take the form of some emergency, and in the case of this cold February month, the distraction was caused by frozen pipes and irate customers. But the February revenue was really good, and the overall margin was good, so what was the problem?
The problem is that not all margin dollars are equal. That sounds silly, but it is true. For this February period, DunnWell did not cash some checks for planned maintenance because we were busy cashing checks for emergency work. How do you suppose the customers that were due for planned maintenance felt when we did not show up as promised? How about the customers whose pipes burst? Do you suppose they were happy with the emergency response fees? And do you believe those emergency service dollars are going to show up consistently every February like contract maintenance dollars do? Nope. Emergency service calls by their very nature are unpredictable – the opposite of consistent results. So even though revenue was higher and overall margins were acceptable, that cold February was a failure. Just because the gross margin on every job is in an acceptable range does not mean that the business is performing in a way that maximizes value for the owners. The emergency “scramble” gets in the way of the Bernie Madoff lesson that teaches us that consistency is better.
So fraud is never a good road, but Bernie understood very well what investors want. You can take a lesson from his fraud and focus your business on minimizing the chaos and disruption of “break-fix” type services and instead attempt to maximize the revenue you receive from consistent revenue services like monitoring, inspections, planned maintenance, and planned retrofits and repairs. Next week, we will do a follow-on post to describe the metrics and give example management charts that you can use to be certain you are on the right road to maximizing the consistency of results to yield the highest value for your shareholders.
I am amazed at how often I see service contractors spending extraordinary effort to measure the gross margin of each service call, job, or project to two decimal places while simultaneously making zero effort whatsoever to measure and understand the value of their business in total. Service call gross margin is a very poor proxy measurement for the overall value of the business to its shareholders.
Any financial calculation of investment value is always about the current value of a future stream of income. The more certain and less volatile that future stream of income, the higher the premium that can be paid today to own that future income – i.e. to become a shareholder. For a service contractor, optimizing this value is all about having a large set of somewhat diverse customers that spend predictable amounts of money each year for the maintenance, monitoring, repair, and upfit of their important equipment. It is also about having a sales approach that regularly adds new customers to the portfolio while simultaneously having high customer satisfaction levels so that few customers ever terminate the relationship.
So what questions should you be asking as a shareholder to determine the value of a commercial service contracting business (or any other high value, maintenance or subscription-oriented business)? Here are a few ideas to get you started. Let’s see how you do in answering these:
How many customers do you have under an annual or longer maintenance contract?
What is the monthly recurring revenue (MRR) or annual recurring revenue (ARR) for the set of customers that have a maintenance contract?
What is the total contract value (TCV) of future committed revenue for all customers under contract?
What is the annual contract value (ACV) expected to become revenue in the next twelve months?
What is the amount of deferred revenue on the balance sheet that reflects payments collected in advance for services to be delivered in the future? What is the ratio of this number to the ACV number above? To the TCV number above? The higher these ratios, the more committed the customers are to your contracts.
What is the ratio of planned work revenue (maintenance, inspections, quoted repairs) to unplanned work revenue (emergency or priority service calls where something broke)? The higher this ratio the better the customer service being delivered. Customers do not like unplanned expenses nor the disruptions they represent.
How much does it cost in sales and marketing expense to land a new customer (the cost to acquire a customer or CAC)? What is the ratio of that cost to the first year average revenue from a new customer?
What is the net revenue churn in the customer base? How much revenue did you get this year from customers that have been with you for over a year relative to the revenue from those customers for the prior year? Minimal churn means your digital wrap is sticky.
What is your contract renewal rate? What percentage of customers do not renew their maintenance plan when it comes due? How much annual contract revenue on average do these non-renewing customers represent? These numbers represent your gross churn.
All of these questions are directly correlated with the value of a service contracting business (or any subscription-oriented business for that matter), and not one of them deals directly with the question of gross margin for a service call. Service call gross margin is important, but gross margin on contract maintenance, inspections, and planned repairs is actually much more important. No investor will complain about an occasional expense hiccup for unplanned services in the context of a highly predictable stream of high margin, contract service fees. The very nature of unplanned work (it is unplanned!) makes it volatile and not particularly valuable to an investor.
So what is the formula for managing the business toward the highest return for the owners of the business? If service call gross margin is the wrong metric, what are the right metrics? And how can they be measured regularly to assure the business strategy is generating high shareholder returns?
As I indicated above, the basic finance formula for determining the value of an investment is to assess the amount and the risk of future income streams. Of course, predicting the future is tricky business, so it is best to rely on historical trends as a proxy for future performance, along with a healthy dose of common sense. With that in mind, I have developed a simple, easy to remember mantra for service contractors to keep in mind as they consider strategic initiatives to increase the value of the business:
How Many? How Much? How Long?
These three questions underpin the basic value-building fundamentals for almost any business.
A continuation of this chapter with tactical examples of how to measure “How many? How much? How long?” is included in our How Valuable Is Your Brand? Part 2.
As I indicated in my previous post, the basic finance formula for determining the value of an investment is to assess the amount and the risk of future income streams. Of course, predicting the future is tricky business, so it is best to rely on historical trends as a proxy for future performance, along with a healthy dose of common sense. With that in mind, I have developed a simple, easy to remember mantra for service contractors to keep in mind as they consider strategic initiatives to increase the value of the business:
How many? How much? How long?
These three questions underpin the basic value-building fundamentals for almost any business.
How many?
“How many?” refers to how many customers the business services under a contract. It can also be how many locations or customer assets are under contract. Likely all three need to be measured. Any business that is overly reliant on a small number of customers, even if they are large customers, has higher risks associated with their future income streams. A single screw up or a change in management at the customer can put the entire company at risk. It is better to have many customers with many locations so that the risk and volatility of the revenue portfolio are lower.
At the end of every quarter and every year, you should measure how many customers or locations were serviced that quarter compared to the same period in the prior year. Do you have more customers and locations under contract now? How many customers that were serviced last year declined service or canceled their contract this year? How many new customers were added under contract and serviced this year? As a percentage, what type of growth does this represent? How much did you spend on sales and marketing to add those new customers (sometimes this is difficult to measure precisely because marketing spending tends to come well ahead of actual customer wins, sometimes by several quarters or even years)?
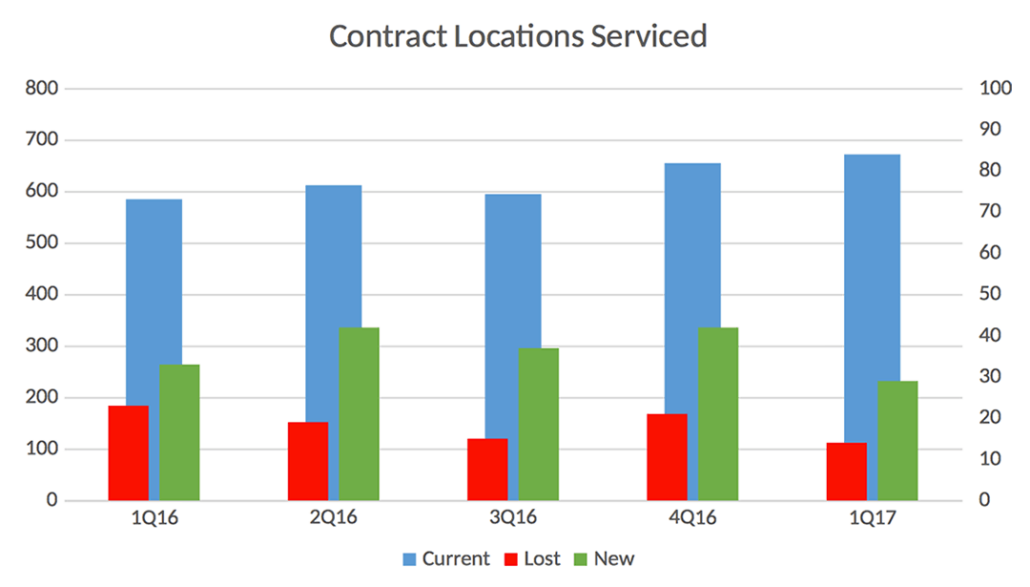
Here is my favorite chart for plotting the progress of the business in maximizing the how many? metric.
It shows the number of customers/locations serviced in the quarter, the number that declined service or canceled, and the number of new customers added. The customer locations lost and the newly added locations are plotted on the second axis because these may be small in a large, mature business with lots of customer locations under contract from years of servicing the market. Ideally, everything but locations lost is going up and to the right. The number of new customers/locations added should also exceed by a good margin the number that canceled. Otherwise, the “churn” in the customer base will eventually decimate your business if it continues over too many quarters.
How much?
“How much?” refers to the amount of revenue you can collect from a given customer or location. The higher the number the better, of course. There are generally two ways to drive this metric higher: 1) raise prices to charge more for what you do, and 2) do more for the customer. Investors love companies with pricing power in their markets. Companies that can raise prices without losing customers to the competition are valuable to shareholders. Customers love companies that can do more for them because their overhead associated with vendor administration is lower. It is also more difficult to replace a vendor that is doing many things, so your services are likely to be more durable in the face of a hiccup or challenging customer service situation.
Every quarter, you should measure the amount of revenue you earned from each customer and each group of customers relative to the amount of revenue you earned in the prior year period. Were you able to raise prices? Did customers respond to your solicitations for larger amounts of their business? Did they buy new innovations or suggested upgrades that you recommended?
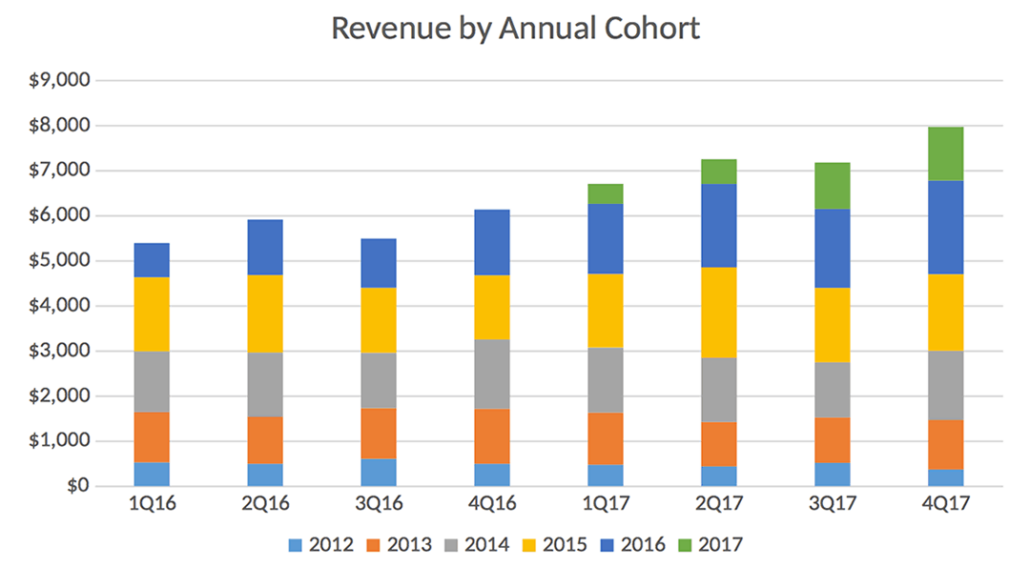
I suggest that you break your customers up into groups or “cohorts” indicating what year they initiated the service relationship with your company. You can plot a view of how much money you are getting each year from customers that have been with your company for one year, two years, three years, four years, and so forth and so on. Ideally, you are growing within each cohort group for the first few years and then holding onto most of that business during subsequent years. Some churn after a number of years is understandable as companies go out of business, merge and change strategies, or experience other corporate disruptions that ultimately affect their relationship with you. However, if you can show strong growth from sales to existing customers along with staying power within accounts as a business pattern, a new investor will pay you a premium for that trend.
Here is a chart that shows how revenue breaks down by customer cohorts grouped into the year you landed the service contract with the customer.
Notice how the recent cohorts start smaller, grow over time, and then hit a steady state before a slow decline.
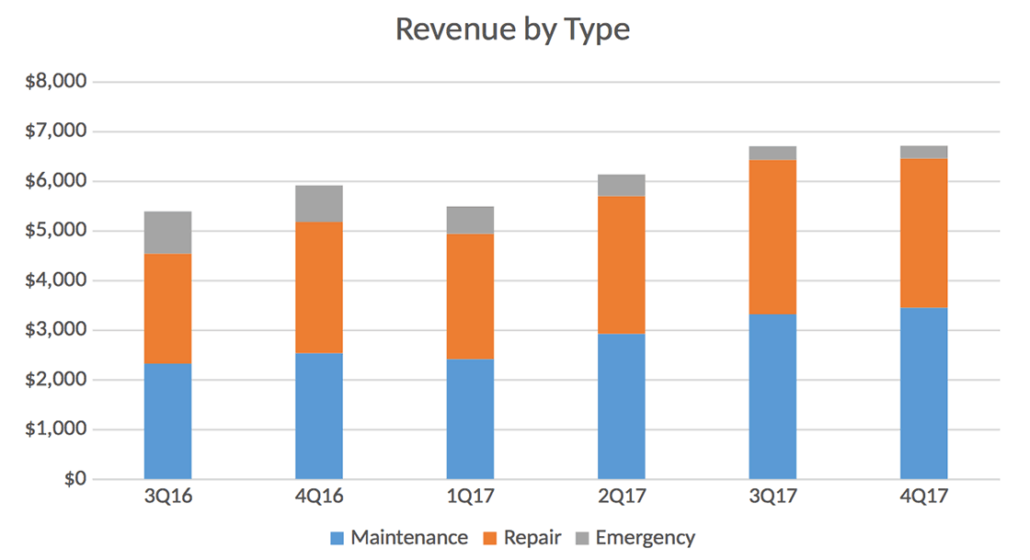
You should also measure how much? as a function of the type of revenue you are recognizing. I would suggest three different categories – contract maintenance or program subscription fees, planned repairs and upfits associated with quoted work, and unplanned repairs such as emergency service calls. You want to demonstrate a pattern over time of an ever increasing portion of your revenue coming from contract fees and planned work as compared with emergency service calls, which are typically associated with customer equipment malfunctions.
Planned work is more efficient and more scalable because the logistics can be meticulously coordinated. Customers benefit and your business benefits when you can plan the work to avoid excess travel time, expedited parts shipping, overtime expenses, and the general administrative stress associated with delivering service “right now.” Ideally, you can get the customers assets “under control” and minimize the service calls by quoting planned repairs to replace the risky equipment assets with more robust ones that are less prone to failure.
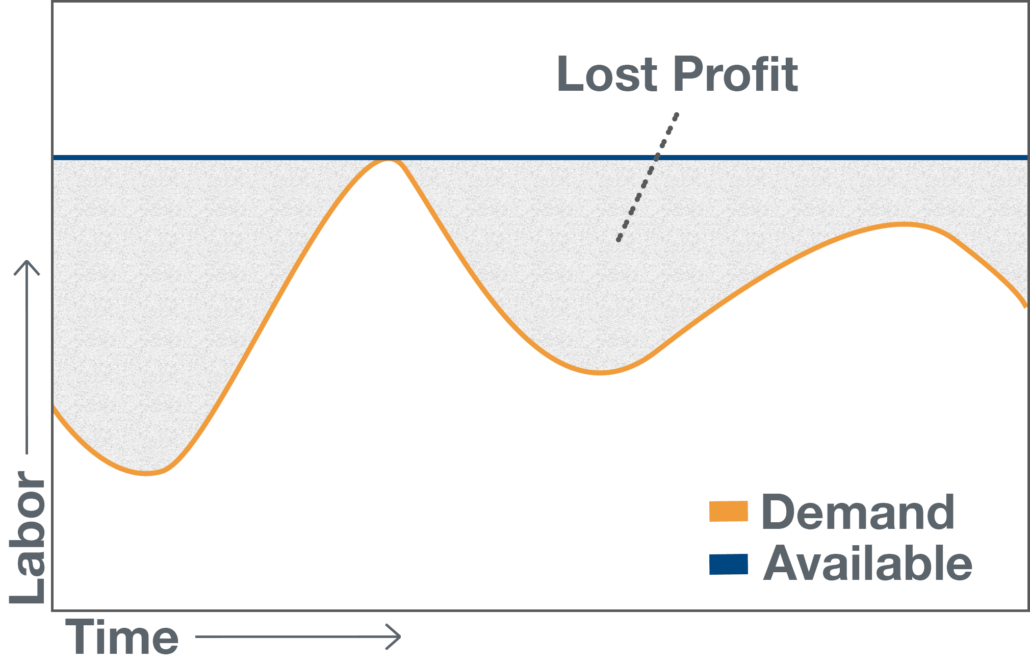
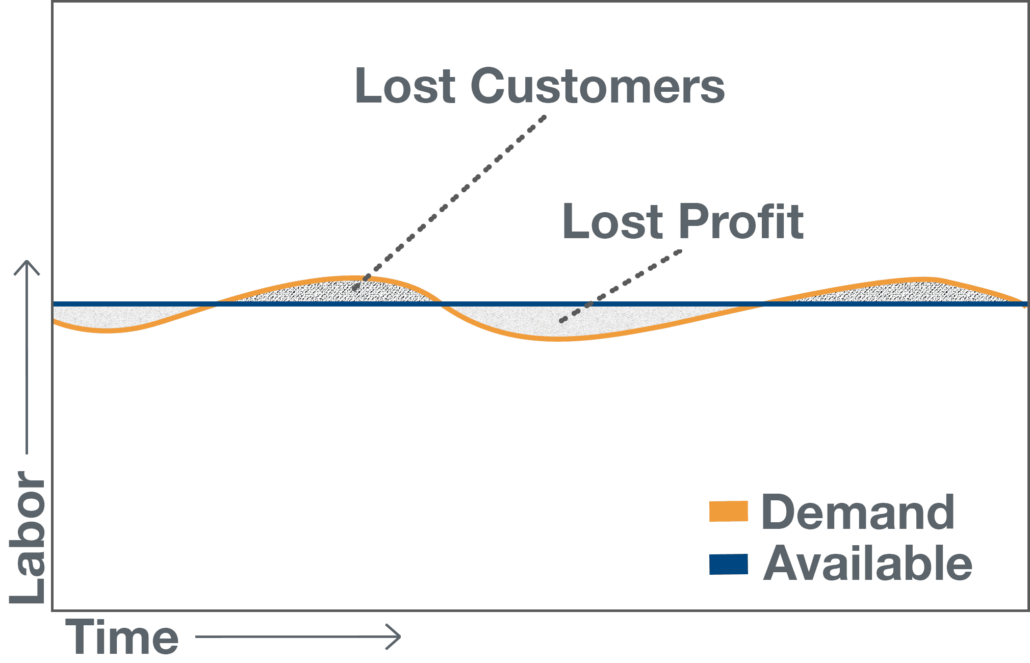
Here are a couple of graphic illustrations that demonstrate why you want to pursue a strategy that ultimately transitions your revenue mix from unplanned, service call work to programmatic contract work and quoted work.
The oscillating, sine-wave-shaped pattern represents demand associated with random equipment breakdowns when no programmatic approach is in effect across the customer base. If you scale up your technician workforce to deliver great service in the face of random peaks in demand, you will be losing lots of money as you keep that workforce in place during the random slack periods.
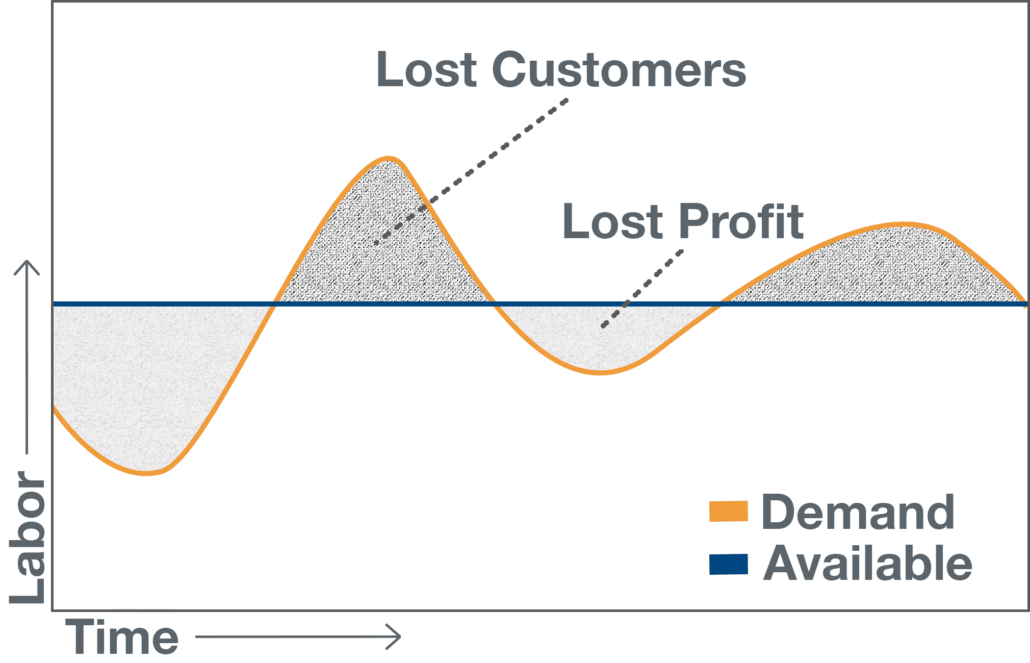
If you scale back your technician workforce to avoid the plunge in profits when demand tapers, you are at risk of delivering poor customer service during the peak periods.
The ideal situation is to get the customer demand curve “under control” on a customer by customer basis by putting them into a contract that incents both you and them to programmatically eliminate the risks that ultimately drive equipment failure.
In this case, customers pay more for your maintenance program and monitoring fees, and in return, they have less risk of failure and fewer unplanned expenses. If you do a good job demonstrating to them the story of their equipment via video and photo evidence, they will not have a problem with the program fees, and they will generally accept your advice regarding repairs, retrofits, and upgrades that further eliminate risks, disruptions, and unplanned expenses. The ideal situation, as always, is that you are getting “money for nothing” while the customer sees daily evidence through your digital wrap that they are indeed paying for “something” very valuable.
How long?
In addition to measuring how many? and how much? on a periodic basis, you also need to measure how long? which refers to the duration of your relationship with a customer. If you can create a really sticky digital wrap that reinforces the story of your brand throughout the service cycle, you should, in theory, be able to hold onto those customers forever. Ideally, you are actively working your pricing model to manage your portfolio of customers by raising prices on those customers that do not fit with your model and in other cases perhaps trimming prices or offering other value-added services at a discount with those customers that are your prized possessions. In fact, once you become comfortable in your marketing and sales strategy and the cost of attracting new customers that fit the model, you will probably begin actively firing customers that do not fit by not renewing their contracts or simply directing them to your competitors when they call for service.
Investors love sticky brands with repeat customers that pay up year after year on a subscription basis to continue receiving the terrific results from the relationship. However, investors are just like customers in that they generally do not want to pay for nothing. In this case, nothing refers to sales pitch platitudes that ultimately add up to “Trust me! It’s gonna be great! Just sign the check so I can cash it!” You have to provide the evidence that your “money for nothing” program really yields higher returns in the form of a predictable income stream. Show them the charts that you use to measure the business value you are generating. I bet they are impressed, and you might be surprised at just how much “money for nothing” you get if you ever decide to sell shares in your company.
The bar graphs in this post were created from data in ServiceTrade with Amazon QuickSight. Learn more about how you can use this Business Analytics tool to uncover insights in your own service data.


