Good is Not Good Enough – How Amazon Raised Expectations to Feel Good for Commercial Service Contractors
Several dozen books (at least) have been written about the Amazon phenomenon, and I could probably go on and on myself about the lessons that can be drawn from its success. The lesson for the service contractor is that making your customers feel good about your service will likely lead to greater riches for you and your company. Jeff Bezos is the richest guy in the world, and he has been pretty clear that his success comes from innovations that make the customer feel good about doing business with Amazon. Many of these innovations are directly applicable to a commercial service contracting business, and you should take inspiration from them to deliver your own version of “feel good” customer service features.
Pictures and video. Amazon understands the psychology of human decision making. Images impress us. They help humans understand their environment and make decisions. We are more easily impressed by images and stories than we are by bullet points and descriptive prose. I challenge you to find anything for sale on Amazon that does not include at least one picture. Generally there are several, and Amazon gives you tools to zoom and pan to get a better view of the details that might interest you. It is easier to feel good about a purchase when we can see the images that reinforce our buying decision. Increasingly video is also becoming a part of the purchase review because it combines imagery with a story about the product.
Reviews. Reviews are the stories other customers choose to share about their experience with the product. Like images, stories are a powerful learning mechanism for humans. By reading stories, we get comfortable with the experience we can expect from the product. We also understand any trouble we may face through these review stories. Reviews further empower the customer as well because a poor customer service experience and a bad review is often the catalyst for a company to correct the problem. The ability to hold the company accountable to a good experience through a review process gives the customer more comfort at the time of purchase.
Convenience. One of Amazon’s first innovations was one-click purchasing. They applied for and were awarded a method patent on this invention back in 1999. Amazon famously sued Barnes and Noble when they copied the innovation. Amazon had streamlined the purchase process by eliminating the hassle of checkout, and the company was not going to stand by quietly when their fiercest competitor attempted to copy this convenience innovation. Now the company offers a mobile app (of course) so customers can easily browse and buy from their phone. Additionally Amazon provides multiple delivery and gift options, smart speakers that let you buy with Alexa commands, push button buying using a little connected clicker called a Dash button for common items like laundry detergent, and many more buying innovations. The company is even experimenting with flying drone delivery. Eliminating all of the barriers between your customer’s money and your bank account just makes sense.
No Hassle Returns. Amazon never argues with a customer regarding a request to return an item so long as there is some reason for the rejection (fit, color, quality, whatever). They make returns easy with a self-service process from their website. Customers feel better about placing an order when they know they can return the product if something is not right.
Mobile experience. Amazon enhances convenience with their mobile app because shopping is always available. Most customers are never more than three feet from their phone, and therefore I believe mobile is worthy of its own feel good category. Because my smartphone has a camera and a microphone, I can take photos (or scan barcodes) to search for products as well as giving verbal commands. I can also manage every aspect of my relationship with Amazon through my mobile device, which means I can manage it anywhere and anytime.
Feel good by doing good. The Amazon Smile program allows me to select a charity to receive a donation from Amazon equal to .5% of my qualifying purchases when I begin my shopping at smile.amazon.com. Do you imagine that a customer feels good when they begin their shopping experience by typing “smile” and then direct a contribution to a favorite charity when they buy something? It is easy to feel good when your vendor helps you do good.
Notifications and visibility. Amazon gives customers a number of ways to track their orders and their order history with the company. Any shopping activity, whether resulting in a purchase or not, generally results in some level of follow up from Amazon. If I place an order, Amazon continuously informs me of the status from a “thank you” order confirmation. They send a shipment notice plus an arrival notice. If I shop and do not order, Amazon often follows up with deals on items that I viewed hoping to push me over the edge to actually buy the product. After I receive a purchase, I am generally offered an opportunity to review the purchase, and I will typically be offered several complementary items. Beyond these notifications, Amazon tracks my purchases so that I can reference that information to make decisions regarding future purchases. All of this attention and account visibility certainly helps the customer feel good about their relationship with Amazon.
Subscription membership. Amazon offers customers a subscription program called Prime. Prime bundles all manner of Amazon services and benefits into a subscription program for which customers pay an annual membership fee. The subscription offers access to a library of books and music along with lower costs (usually free) for shipping and guaranteed two-day delivery for any purchases. Statista, the online statistics portal, estimates that Amazon had 95 million US Prime members as of June 2018. That amounts to nearly seventy-percent of US households participating in Prime. It feels good to be a member of a club with a wide range of benefits and a subscription business model with its predictable and guaranteed cash flow is a powerful foundation from which to build a dominant brand.
Commercial service contractors should take a lesson from Amazon: making customers feel good about your services will likely lead to greater riches for your company. The best part is, many of the innovations that make customers feel good about doing business with Amazon can work for you.
Good is Not Good Enough
Amazon does not settle for “good” in the realm of customer service. It is not enough for the customer to simply get what they paid to receive. Amazon wants customers to enjoy the experience in the same manner as a guest might enjoy a good party. Great brands now want to copy Amazon because Jeff Bezos has become the wealthiest guy in the world due to the crazy success of Amazon stock. Smart business owners want the same value for their shareholders, so they are behaving like Amazon and aiming well beyond the idea of simply satisfying the customer. They truly want their customers to “feel good” about the experience of buying from them. This current obsession with the customer experience is certainly a good thing for customers. Because so many companies are now focusing on innovation in customer service, the bar for “feel good” status is climbing higher every day.
The most popular approach today for measuring customer satisfaction is the Net Promoter Score, or NPS. Wikipedia reports that more than two-thirds of the Fortune 1000 are currently using NPS. Here’s how it works.
Customers are asked a single, simple question:
How likely is it that you would recommend our company/product/service to a friend or colleague?
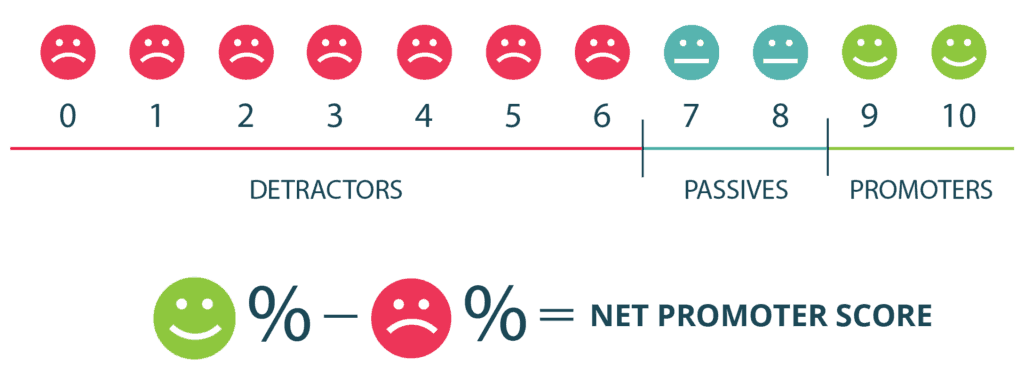
Respondents are then given an option to answer that question with a number rating on a scale between 0 and 10. 0 means that the customer would never recommend the company to a friend or colleague, and 10 means that they would absolutely recommend the company to a friend or colleague.
Next, respondents are categorized into the following groups: Promoters – those who score the business with a 9 or 10, likely to promote to others Passives- scored 7-8, not likely to benefit or harm your brand Detractors- scored 6 or less, a liability for your brand
The final NPS score is calculated by subtracting the percentage of Detractors from the percentage of Promoters, with the Passives not contributing at all to the score. As an example, if you were to survey 100 customers and 35 score as Detractors (0 to 6), 25 score as Passives (7 or 8), and 40 score as Promoters (9 or 10), your NPS score would be:
Promoters – Detractors = NPS 40 – 35 = 5
Your NPS for this survey sample is a 5. Anything above 0 is considered to be positive, and a score approaching 50 is terrific.
Now I think all of this is probably a little too simplistic, and you will find lots of scientific criticism for NPS from survey theory experts if you go looking for it online. My opinion and the opinion of all of the other critics is not what really matters in this case. What is important is that two-thirds of the Fortune 1000 are relying on this information in one form or another to help them improve customer satisfaction. A lot of big brands with big budgets are focusing lots of energy on measuring customer satisfaction. The other important thing to note is that this wildly popular tool skews heavily toward “feel good” as the goal for customer service. Only scores of 9 or 10 are credited positively, and anything less than a 7 is negative. I would say anyone that scores a company with a 9 or a 10 feels really good about their experience with the company. So two-thirds of the Fortune 1000 are scheming for ways to get more scores in the range of 9 to 10 because that is the only way to improve their NPS score. That’s a lot of companies with a lot of focus on making customers feel good about their brand.
What does this emphasis on outstanding customer service mean for you? Your business is going to be compared to all of the customer service innovations of Amazon and two-thirds of the Fortune 1000 because they are all “focused like a laser” on customer experience these days. NPS is hot because customer service innovations are hot because customer loyalty is hot because growth is hot because Amazon is hot. Customers are not going to compare you to your “always go low on price” competitor down the street any longer. They are going to ask “Why can’t you be more like Amazon and give me notifications when I am due for service or when the technician is en route to my location?” The customer service bar is going to be set by the sum of all of the best experiences the customer has ever encountered across all companies in both their personal and professional life.
The good news is that most customer service innovations can be observed and imitated if they fit your idea of great customer service for your company. The case of Amazon is particularly intriguing because up until a few years ago Amazon had absolutely no influence over the products customers were buying from them. They were simply a reseller of other companies’ products. Any innovation they delivered to make a customer feel good was not a product innovation but instead was focused solely on the buying experience. In my next post, I’ll discuss the “feel good” customer service themes direct from Amazon that should probably be among the guideposts you use in establishing your “feel good” customer service strategy.
Tellin’ ain’t Sellin’ – Every Customer is From Missouri, So Show Them Something!
When your salespeople call on customers, what are they pitching? What do they present when they get that rare opportunity to show a high-profile prospect the benefit of working with your company? While I have not been in the room often when a commercial service contractor is pitching a customer, I have seen hundreds of websites for these companies, and I have been to lots of trade shows where they are exhibiting. Generally, I am not impressed by what I have reviewed. Mostly I see some version of one or more of the following themes:
We Work Harder! It sucks to work harder than the other guy.
We Care More! Not certain what sucks more – working harder or caring more.
Better Technicians Means Better Service! This is the Papa John’s pizza pitch. You’ve seen examples here, here, and here of how that’s not working.
We’re a Family Business! The mafia is a family business too.
We’ve Been in Business a Long Time! Really? Why are you still such a small company?
Sadly, the website content for most commercial service contractors is typically a long and rambling word salad that doesn’t add up to much value for the customer. Generally, Google is not impressed either as most rank pretty low for relevance in organic search results. I imagine the salespeople are equally unimpressed with the company strategy, so their pitch quickly devolves to price:
How much are you paying now? We’ll get the work done, and it will be cheaper! Let’s negotiate labor rates and a markup on parts! We will be there 24/7 when things go wrong! Call us anytime and we will fix your broken equipment by working around the clock until everything is good again!
Competing on price and some vague promises to work harder and care more and fix broken equipment 24/7 and be more family-oriented sucks. Why should the customer believe anything the sales rep is saying? How can your sales representative make an impression that moves the conversation to valuable outcomes instead of a mark-up on the cost of the labor and parts?
Of course the most important thing the salesperson can do is ask questions and understand the goals of the buyer through some discovery conversation. The other thing that should be offered is a premium program, but do not expect the customer to buy on the promises and platitudes of a sales rep. Tellin’ ain’t sellin! Your sales people should be able to show the customer the value of your brand by demonstrating how the program works. I am fond of declaring that all customers come from Missouri, which is known as the “show me” state. If you can’t show them the value, you will not sell them the program.
So what does a premium program look like? And how can you demonstrate it to the customer in a way that is meaningful to them? Let’s have a look at some examples from other industries to gain insights into components you should consider.
Amazon Prime – Amazon offers a subscription program called Prime, and nearly 70% of US households are Prime members. Prime members pay $119 per year in exchange for free two-day shipping, access to a library of movies, television shows, and music, and a free Kindle book every month, among other things. The most important thing Prime does, however, is put Amazon at the top of the heap when a subscriber considers how to buy the next bag of dog food, or supplies for their kitchen pantry, or Christmas gifts for their friends:
I’ve already paid for Prime, I might as well benefit from the free, expedited shipping!
The program helps keep the Amazon brand top of mind for future purchases, and customers pay for this marketing trick through their subscription fees! It’s brilliant marketing by Amazon. Amazon allows prospective customers to try Prime free for a month to experience its value because Amazon knows that all customers are from Missouri. The free trial “shows” the customer why Prime is valuable instead of just “telling” the customer that it will be great if they buy.
BMW Ultimate Care – BMW is a premium automotive brand that delivers what they claim is the “Ultimate Driving Machine,” and Ultimate Care is their premium maintenance program. You pay in advance, typically at time of purchase when financing is also a part of the conversation. Ultimate Care provides unlimited service consistent with the manufacturer’s recommended service plan. All parts and service required for recommended maintenance are included at a thirty-percent discount. The program is only available at BMW dealership locations, so you will be bringing the car to the dealership and wandering about reviewing all of the latest offerings of BMW as your maintenance plan is delivered.
Once again, brilliant marketing. You payin advance so that you will certainly use the service that requires you to come to the dealership on a regular basis. No doubt you will get a loaner for the latest model at the upper end of your price range for any extended service requirements. The dealership is having the customer pay fees in advance of service to help them deliver a hassle-free experience and market their latest offerings to the customer on a regular basis.
Brandt STORM – Brandt Engineering is one of the largest mechanical contractors in Texas, and STORM is their premium program. STORM stands for Service, Technology, Optimization, Retro-commissioning, and Monitoring. When the customer buys into the STORM program, Brandt does a top-to-bottom review of the equipment while installing monitoring technology to track key performance data on the critical elements where failure results in expensive disruptions. Once they and the customer agree the equipment condition is worthy of a performance promise, STORM is initiated. The customer receives regular communication and attention from Brandt engineers and technicians while simultaneously benefiting from lower rates on service requirements and ideally lower utility costs.
The customer is paying Brandt the money they are saving on utility bills and breakdowns as subscription fees in order for Brandt to continuously remind them of the value of the Brandt brand! That trade-off is certainly worth the risk to Brandt of a failure where Brandt must pay the premium (expedited parts, overtime labor, etc.) for recovery instead of the customer paying it. These risks are minimized through information, and the customer is conditioned that any retro-commissioning recommendations (quotes for new equipment) based upon the data are in their best interest to avoid performance disruptions that fall outside the STORM promise. It is brilliant.
So what are the lessons you should take from these examples?
1 – Brand the Program. What is your version of Amazon Prime? Ideally the name helps the sales rep to tell the story, to get the conversation going with the customer, and then the customer remembers your brand. A good name demonstrates your company’s thoughtfulness in how you communicate your value.
2 – Show, Don’t Tell. Your sales people need to be prepared to give a demonstration of the program. Amazon gives prospective Prime members a month of free Prime membership to try out all of the benefits. Do your sales people have a way to easily give the customer your branded program experience?
3 – Promote the Features. Can you enumerate the features of the program? In a list? Spend some time thinking about the names of the features.
4 – Get Paid for Nothing. If the only time you send a customer an invoice is when you have a labor or parts line item to bill, guess what? They are going to assume your value is in the labor and parts instead of the program. The fewer invoices you send to the customer, the better. Ideally, have them pay annually in advance. It’s better for you and cheaper for them.
5 – Offer a Good Contract. Put in place a master service agreement, a rate schedule, and a service level agreement. Good fences make good neighbors and good contracts make good customers.
None of these elements of a premium program are rocket science, but it is surprising to me how rarely they are implemented by service contractors. Do not let shoddy practices in your industry nor weak competitors that always sell on price dictate your business model. The executive management of your company should spend at least fifty percent of their time working on program and marketing innovations that set the brand apart from competitors. Innovation rarely happens by accident, and it is the key to having a differentiated value proposition.
AI, IoT, M2M, Big Data – The Alphabet Soup of Technology Jargon You Need to Understand (Part 2 of 2)
This week’s post is a continuation of an introduction to AI, IoT and Big Data with the help of the 1984 movie The Terminator. Re-read that post here.
Let’s rearrange the AI, IoT, and big data alphabet soup of technology jargon to come up with a simple question that helps you cut through the hype and delivers some focus for your technology strategy. I am going to drop a few words from artificial intelligence, Internet of things, and big data to make my point. Here we go:
“How can you use the Internet to collect data about customer equipment so that you and your customer can make intelligent decisions about services that will minimize risk, expense, and business disruptions caused by suboptimal equipment performance or equipment failure?”
I really don’t care if the data is “big” or “small.” I don’t care if the information that comes over the Internet is generated by a “thing” or by a person holding a smartphone taking photos of an impaired piece of equipment (although “things” are often cheaper than people as collection devices). I also don’t care if the “intelligence” is artificial or natural so long as it is smart and not dumb. The overall direction of technology, of course, is toward bigger data, more things connected to the Internet, and more intelligence that is artificial versus natural as computing gets cheaper and people get more expensive.
Now that we have generated a simple test to cut through the hype and focus our innovation lens on practical and actionable solutions, what are some examples that illustrate the potential value of this strategy? How are you currently and in the future going to collect data over the Internet to make more intelligent decisions regarding equipment services that should be delivered to optimize performance? You don’t have to wait for the day that the terminator is a reality.
Real World Example: AI at Work
The favorite workflow of ServiceTrade customers is the recording of equipment deficiencies by technicians using the mobile app and the subsequent online review of a quote by the customer to approve a related repair. Let’s see if this workflow meets the test of our strategy.
Are we collecting information about equipment via the Internet? Yes. In this case it is photo, video, audio, and text captured by the technician that illustrates the problem to the sales person in the office and ultimately to the customer.
Are we using intelligence? Yes. The technician knows this situation can lead to a failure, otherwise why record it? The sales person also recognizes the problem because of the detailed data set, and she applies the correct quote template for repair based upon prior experiences – how much time, which tools, which parts, etc.
Finally, the customer can trust the information to make a good decision because he sees and hears the problem. Just like the “look through” scenes in The Terminator, we know that intelligence is being applied because we can see it happening. The customer sees what the technician sees.
Real World Example: How IoT Reduces Chaos
Sensors are getting super cheap and the power requirements are getting so small that battery life is often measured in years. Consider fire sprinkler customers that have risk of pipes bursting due to freezing in certain areas of their facility that are not temperature controlled. Setting up a temperature sensor that generates an alert below freezing temperature could easily trigger a response to turn on some space heaters. If the heaters are connected to some sort of “smart” electrical circuit, perhaps they deploy on the signal without any other intervention. This seems like a small thing, but during cold snaps in normally moderate climates, it is amazing how many sprinkler pipes freeze. OK, does it pass the test?
Did we collect data on the Internet? Yes, through an ad hoc temperature sensor.
Are we using intelligence? Yes, intelligent people know that water freezes at thirty two degrees, and we know that plugging in a space heater will keep the temperature above that threshold.
Did our decision and action avoid disruption and maintain optimal facility performance? Yes. Great, we are off to a terrific start with our AI, IoT, and big data strategy!
Real World Example: Big Data Brings About Better Decisions
Big data is simply a buzzword for datasets that are generally so large that a simple tool like Excel with a human interface might struggle to parse any intelligence from the data. All of the data in ServiceTrade is automatically ported over to Amazon’s Redshift/QuickSight big data analytics platform. A simple analysis will show customers spending habits related to emergency service versus planned services (preventative maintenance and planned retrofits and repairs). During an annual review with a challenging customer that insists on minimal preventative maintenance, you might be able to demonstrate that a similar customer that opts for maximum preventative maintenance is spending significantly less overall during the course of the past 3 years. No one could parse that amount of data in Excel, but QuickSight handles it easily with just a few clicks. OK, does it pass the technology strategy test?
Did we collect data on the Internet? Yes, all data in ServiceTrade is collected over the Internet because ServiceTrade is a SaaS application.
Did we make an intelligent decision to lower expense, lower risk, and optimize performance? Hopefully the answer is yes because ideally the customer buys into your premium program based upon the analysis that indicates lower total costs.
Let’s quickly contrast these straightforward examples of effective and simple technology deployment for achieving a mission with a “technology solution trying to find a problem.” Google, Snapchat, Intel, and a host of other technology heavyweights have spent years and hundreds of millions of dollars on “smart glasses” that combine cameras, heads up displays, natural language recognition, cellular networking, etc. Some vendors in the contracting space latched onto this science experiment and began selling it as the productivity solution for all of your problems. It enabled customer collaboration, technician training, remote diagnosis, and a host of other benefits (according to the vendors). It didn’t work.
Taken in pieces, elements of the technology make sense. A small, bluetooth camera clipped to the bill of a ball cap with a similar bluetooth earpiece all tethered to the mobile phone will enable the technician to fire up a FaceTime call with a colleague. The two can then collaborate via shared images and a real time conversation to diagnose a problem. The challenge with jamming everything into a new form factor like glasses is that it is a laboratory exercise instead of a solution to a problem. It is Frankenstein as compared to the terminator. Frankenstein was great science, but yielded only chaos and misery when deployed beyond the lab. The terminator, by contrast, was built for accomplishing the mission in the field.
Your objective is to assemble the terminator and avoid Frankenstein. The examples above clearly indicate that AI, IoT, and big data are already a part of the arsenal of technology you are using for the benefit of your customer. It really is not rocket science, and you really can embrace new innovations if you are willing to explore and set aside the intimidating jargon in favor of a elegant strategy. Your strategy should simply be a trend of collecting more data via the Internet so that you can intelligently make service decisions that optimize the performance of your customers’ important equipment. Any innovation that meets this simple test is putting you on a good path for adding more value. Stay focused on the mission, and the right solutions will present themselves as obvious candidates for your premium service program.
AI, IoT, M2M, Big Data – The Alphabet Soup of Technology Jargon You Need to Understand (Part 1 of 2)
In 1984 I was seventeen years old and working as an usher in a movie theater when the science fiction thriller The Terminator was released. It was a surprise hit, and I must have seen the movie a couple of dozen times. In case you are not familiar with the movie, Arnold Schwarzenegger plays a human-like cyborg, a Terminator, sent from the future with a mission to kill Sarah Connor, the mother of the future resistance leader that is fighting the Terminator’s artificial intelligence master, Skynet. Aside from the obvious standout qualities of Schwarzenegger’s physique (a former Mr. Universe and Mr. Olympia) and the incredible strength demonstrated by the cyborg, the Terminator looks and even acts somewhat human. To remind the audience that the Terminator is actually a very sophisticated computer, director James Cameron sometimes displays the action from the perspective of the Terminator.
In these “look through” scenes, the audience is presented with a screen that is apparently the field of vision of the Terminator. The film color quality is replaced with mostly red, white and black imagery. Superimposed on the imagery is a bunch of scrolling text gibberish and some highlighted, flashing square boxes to call attention to certain data elements the Terminator may be analyzing – a person’s body size for suitable clothing, weapons in the hands of potential antagonists that must be foiled, etc. Of course, if the Terminator was really a sophisticated computer cyborg, there would not be an internal display barfing computer gibberish onto a screen in a manner that was readable by humans. Computers do not need human-readable text to operate on data the way humans need it. The computer would simply be ingesting external data via the cyborg’s camera eyes and his microphone ears along with any other external sensors for temperature, pressure, odor, and what not. Based on this observed data, the Terminator would be making judgments and taking actions that would have a high probability of creating a path to accomplish the mission – the termination of Sarah Connor. All of this would be happening without a human readable screen display.
Why am I talking about The Terminator? Why is the detail of the Terminator’s view of the world as depicted by the movie director important? I am talking about The Terminator to illustrate the point that artificial intelligence (AI), the Internet of things (IoT), big data, and all of the other alphabet soup puked up on a daily basis by technology media and vendors hyping their products is generally nothing more than the collective, gradual evolution of computers. In 1984, James Cameron could imagine a computer that understands and speaks natural language, sees real-time imagery, reacts to its environment, and takes actions to accomplish the mission. To portray the Terminator as a sophisticated AI being, Cameron showed the audience a visual model that generally represented what computers looked like to the masses in 1984 – a somewhat low-resolution screen with digitized text scrolling on it with an occasional selection option that would become highlighted if you tabbed a cursor to it (remember, the mouse was a new thing in 1984 as the first Apple MacIntosh computers just shipped that year). Cameron could not assume that the audience would make the leap to his futuristic interpretation of an AI-enabled cyborg, so he showed the audience a 1984 computer interface to make certain they got the connection. All this stuff in the media about AI, IoT, machine learning, big data, blah, blah, blah is just the real world catching up to what James Cameron predicted would happen way back in 1984.
Today we are talking to our phone to have it dial our best friend. We are issuing verbal commands to our Alexa assistant to have it order pizza or play our favorite music. Our Nest thermostat is monitoring our habits, such as when we come and go, along with our preferences for ambient temperature in order to take actions regarding raising and lowering the temperature where we live. These common applications of AI would have been totally foreign and inconceivable to a movie audience in 1984. But James Cameron had a vision of what artificial intelligence could potentially accomplish in the future, and he did a really good job presenting that vision to the audience in a way that they could understand it. Let’s do a quick reset on some over-hyped terms – AI, IoT, and big data.
Artificial Intelligence – AI is just the trend toward computers ingesting more diverse data in more formats (i.e. images, audio, natural language, pressure, temperature, humidity, etc.) to enable analysis that leads to judgments and actions related to accomplishing a mission or objective. Because AI is more of a trend than a definitive end-state, AI can simply be classified as Hofstadter, a famous AI scientist, describes it – “AI is whatever hasn’t been done yet.” More accurately, AI is simply the leading edge of new capability for computers to operate more intelligently on a broader diversity of data.
Internet of Things – IoT is simply a trend where more and more things are connected to the Internet to send or receive data or to act upon data received. Historically connections to the Internet were people staring at screens (and increasingly listening to audio speakers) and entering data or responding to data received. “Things,” whether a cyborg like the Terminator or a $10 temperature sensor, don’t need screens (nor keyboards or a mouse or speakers) to send and receive data or to act upon data received.
Big Data – Big Data is simply the collection and analysis of data sets that are too large for humans to effectively parse, analyze, and extract intelligence from using simple programs like Excel. Ever cheaper storage and computing cycles lead to ever-increasing data collection, storage, and analysis. Again, big data is simply a trend and not a definitive end state.
Over time, computers will progress to read a broader spectrum of inputs, make more sophisticated judgments, and take an increasing variety of actions that lead to desired outcomes. No one was talking about AI in 1984 – no one in the mainstream media anyway – because the topic was confined to a small group of computer nerds at top technical institutions like Stanford and MIT. Yet the director of The Terminator could imagine a future where a computer becomes so powerful that it can measure its environment in a humanlike manner, make judgments based upon those measurements, and take intelligent actions to execute a mission – in this case, the termination of Sarah Connor. It is unlikely that anyone who saw The Terminator in 1984 remembers the on-screen effects that Cameron used to connect the audience to the idea that the Terminator was a computer. I bet everyone who saw the movie remembers the Terminator’s mission, however. What was the mission? To terminate Sarah Connor of course.
Whether an innovation can correctly be labeled as AI (or with any other overhyped term of the day) is far less important than whether the innovation helps accomplish the mission. The Terminator’s mission was to terminate Sarah Connor, and the Terminator was extremely well suited for carrying out the mission (although it actually failed in this case). Defining the mission that you would like to accomplish with AI, IoT, big data, etc. is actually much more important, in my humble opinion, than the actual technology you select to achieve the mission. Have you thought about the mission that you want to accomplish using technology?
I believe the mission you are generally attempting to accomplish through technology is to maximize customer equipment performance while eliminating equipment failures so that your customer experiences the least risk, expense, and disruption in their business. The reason that technology is important as an enabler of this mission is because it is generally cheaper and easier to manage (sometimes) than people. If you accomplish this mission, your customer will spend zero dollars recovering from disruptions (lost output, spoiled inventory, damaged property, emergency services) while maximizing the amount of money they spend with you relative to other suppliers.
I will continue this topic next week with real-world examples of how AI, IoT, and big data are being used by service contractors today. I’ll also have some advice to make sure that what you’re building is more like a high-performing Terminator than a cobbled-together Frankenstein monster.
Jeff Bezos, the founder of Amazon, is the wealthiest person on the planet. He owns about 17% of Amazon, and that stake is worth about $115 billion. Amazon was founded in 1994, so Jeff has amassed this fortune in just 24 years. Wow. I bring up the example of Jeff Bezos as a wealth-building machine because he has some unique views regarding how to apply technology to build a company that are directly orthogonal to sentiments that I often hear expressed by the management of service contracting companies.
I have had countless executives and managers in service contracting companies tell me over and over again that the most critical feature for a customer service technology platform is how seamlessly that platform integrates with their accounting system. My sarcastic reply is that the most important feature of a customer service technology platform should be how well it enables amazing customer service. Sarcasm aside, the prevailing wisdom in most service contracting companies is that accounting is the function to be optimized using technology, and, therefore, accounting is the most important function in the business. Poppycock.
The most important department in the business is customer service, and the most important person in the business is the customer. They are the people with the money that you want. Customer service is everyone’s job, so there really should not be a department that is solely responsible for customer service. However, some departments in the business are closer to customers than others, and I believe that accounting is not one of the ones that is especially close to the customer.
For a service contracting business, the employees that are closest to the customer are the technicians. Second in line are probably the sales team, or perhaps the service managers and administrators. Executive management is probably next closest, with accounting bringing up the rear. Jeff Bezos would likely say that a company should focus technology investments first on the customer, then the technicians, then the sales and service administrators, and on down the line. Last and least is accounting. Here are a couple of quotes from Jeff to illustrate my point:
“If there’s one reason we have done better than of our peers in the Internet space over the last six years, it is because we have focused like a laser on customer experience”
“We see our customers as invited guests to a party, and we are the hosts. It’s our job every day to make every important aspect of the customer experience a little bit better.”
“The best customer service is if the customer doesn’t need to call you, doesn’t need to talk to you. It just works.”
“We’ve had three big ideas at Amazon that we’ve stuck with for 18 years, and they’re the reason we’re successful: Put the customer first. Invent. And be patient.”
And my favorite Jeff Bezos quote of all time is:
“Amazon has become an amazing company because our accounting processes are far superior than those of our competitors, and great accounting is what our customers really care about above all else.”1
More sarcasm. Seriously though, I bring all of this wisdom from Jeff Bezos to you because I see so many service contractors who are paralyzed in their technology decision making because they are afraid to rock the boat in accounting. Why is accounting relevant at all? Accounting practices have not changed for decades, and if great customer service leads your customers to spend ever larger sums of money with you, I assure you that the accountants will figure out a way to stuff all that dough into the ledger in a GAAP-compliant manner.
My advice is to focus on the customer. If the accountants get thrown overboard with all of the waves generated by a customer-focused strategy, then I sincerely hope that they can swim. The good ones will hold their seat on the ship, and then help you set a course that safely navigates the waves and yields a customer-centric organization. All the rest that believed accounting was more important than the customer needed to be replaced anyway.
1 In case it isn’t obvious, I made up this quote for comedic effect.
One day you will want to have some outsider set a value for your business as part of an exit strategy or for the purpose of passing the business to a new generation. What management metrics will you use to guide your efforts during the many years leading up to that valuation day? How can you deliver steady, market-beating results that are not affected by the various dips and swings that you inevitably experience while serving your customers? The key is to find a strategy that minimizes volatility and maximizes consistency over a long period. You need to deliver for real what Bernie Madoff falsely projected in order to impress the investors that will ultimately value your business.
Revenue and gross margin are not perfect measurements for management success, so what are the measurements that matter? How can the owners of the business look back at the past month or quarter and make a judgment regarding success or failure? If the business is an investment, it should be measured like an investment, and the investments that people value most highly are those that deliver predictable returns over and over again. Bernie Madoff famously played on this investor bias by cooking the books to show steady and consistent returns, no matter what the market conditions, in order to lure more investors to his Ponzi scheme. Investors will always pay a premium for an investment with steady and consistent returns. So what are you going to measure to be certain you are optimizing for consistent and predictable returns?
Your service contracting business, just like an investment firm, faces uncertain market conditions. Instead of swings in the Dow Jones Industrial Average, the S&P 500, and the NASDAQ, you are dealing with cold weather, hot weather, fuel price fluctuations, tight labor markets, and swings in customer buying sentiment brought about by the same economic indicators that affect Wall Street. In the face of all of these potential distractions, you need a simple and effective formula to focus your team on the long-term measurements that matter so that they can more effectively navigate a path through the potential chaos. I have a simple, easy to remember measuring stick to help you focus your management team on the outcomes that maximize shareholder value, but before I reveal it, see how you do in answering these questions:
How many customers do you have under an annual or longer maintenance contract?
What is the monthly recurring revenue (MRR) or annual recurring revenue (ARR) for these contract customers? This is the predictable maintenance, monitoring, and inspection revenue that always shows up on the income statement regardless of market conditions.
What is the total contract value (TCV) of future committed revenue for maintenance, monitoring, and inspections for all customers under contract? Are your customers signing two-, three-, and four-year commitments to you?
How many customers pay you in advance for your maintenance program? What is the amount of deferred revenue on the balance sheet? A higher amount of deferred revenue means that customers are paying you in advance for your services. Paying in advance means they are more committed to your services and your contract. It also means you can use that cash to fund sales to new customers.
What is the ratio of planned service revenue (maintenance, inspections, quoted repairs) to unplanned service revenue (emergency service calls where something broke)? Higher ratios mean better customer service, and better customer service means customers will stick with your company for a longer term. Customers do not like unplanned expenses nor the disruptions they represent.
What is the net revenue churn in the customer base? How much revenue did you earn this year from customers that have been with you for over a year relative to the revenue from those same customers for the prior year? Ideally, this ratio is 90% or even higher. Minimal account churn means your digital wrap is sticky.
What is your contract renewal rate? What percentage of customers do not renew their maintenance plan when it comes due? How much annual contract revenue on average do these non-renewing customers represent? These numbers represent your gross churn, and ideally, gross churn should be less than 10%.
All of these questions are directly correlated with the value of a service contracting business (or any subscription or maintenance oriented business for that matter), and not one of them deals directly with the question of gross margin for service calls. Service call gross margin is important, but gross margin on contract maintenance, monitoring, inspections, and planned repairs is actually much more important. Predictable growth is even more important. No investor will complain about an occasional expense hiccup for unplanned services in the context of a highly predictable, growing stream of high margin, contract service fees. The very nature of unplanned repair work (it is unplanned!) makes it volatile and not particularly valuable to an investor, so optimizing gross margin on this work is the least of your concerns. Try to eliminate these disruptive emergency service calls altogether if you can.
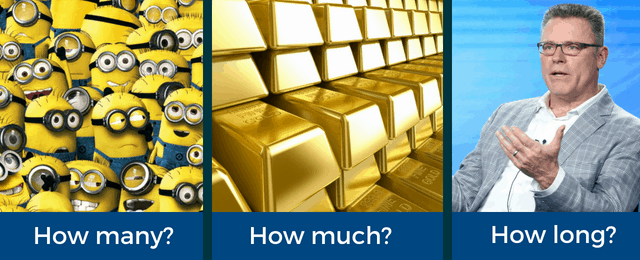
I recognize that many of the questions above are kind of technical and difficult to absorb until you get into the swing of these measurements. It comes down to three simple questions to ask over and over again:
How Many? How Much? How Long?
How many customers you have? How much you earn from them? And how long you keep them?
These three questions that we’ve been talking about underpin the basic value-building fundamentals for almost any business. Read more about How Many? How Much? How Long? value calculations here.
Fraud Doesn’t Pay, But Consistent Results are Worth Billions
Bernie Madoff was arrested in 2008 for running what is believed to be the largest Ponzi scheme ever. Over a period of more than twenty years, Madoff had convinced wealthy, high profile private clients like Steven Spielberg and the Wilpon family (owners of the New York Mets) along with sophisticated commercial clients like MassMutual, Banco Santander, and HSBC to entrust their money to his firm. The reason these folks went along with the scam is not because Madoff delivered eye-popping results with a brilliant strategy. He was not like John Paulson, who famously made over four billion dollars personally in a period of less than twelve months by using credit default swaps to bet against the subprime mortgage lending market. Madoff drew high profile clients and sophisticated financial firms into his orbit by falsely projecting modest but consistent returns. Over a period of 174 months (just longer than fourteen years), Madoff reported results that were only modestly better than the return of the Standard and Poor’s index, but over that very long horizon, he only reported a monthly loss seven times. This extraordinary consistency led several financial forensics investigators to question Madoff’s legitimacy, but the allure of consistent, albeit modest, positive returns was a powerful magnet for investors. They all turned a blind eye to the fraud while funneling enormous sums of money to Bernie.
The lesson for the service contractor is not that fraud is a good road; Bernie is serving a 150-year sentence for his crimes and the related $17.5 billion in losses he cost his clients. The lesson for the service contractor is that predictable, steady growth over a long period of time is an irresistible attraction for sophisticated investors. One day you will want to have some outsider set a value for your business as part of an exit strategy or for the purpose of passing the business to a new generation. What management metrics will you use to guide your efforts during the many years leading up to that valuation day? How can you deliver steady, market-beating results that are not affected by the various dips and swings that you inevitably experience while serving your customers? The key is to find a strategy that minimizes volatility and maximizes consistency over a long period. You need to deliver for real what Bernie falsely projected in order to impress the investors that will ultimately value your business.
In an earlier blog post about Red Hat, I described the efforts that Red Hat undertook to avoid being labeled as a company that provided “break-fix” support for technical issues associated with Linux technology. The directors at Red Hat were savvy investors, and they understood that a volatile “break-fix” revenue model was far less valuable than a consistent subscription model. During my time with DunnWell, the service contracting company that preceded ServiceTrade, I witnessed firsthand the difficulty of delivering steady, predictable income performance when the mix of services leans too heavily towards a “break-fix” model. One particular management meeting stands out in my mind. It was a March meeting to review the February results, and the tension between the steady, predictable outcomes of maintenance work as compared to the more volatile “break-fix” type work became vividly clear.
February temperatures that year had been brutally cold throughout much of the country, and lots of sprinkler pipes had frozen at our customers’ locations, even in the southern states. The emergency revenue was very high for that February as we responded to so many frozen pipe situations. The maintenance and planned repair revenue, however, was somewhat lower than expected, but the total revenue exceeded our target by about fifteen percent based upon the strength of the emergency service calls. The gross margins were OK, but not what you would expect when you have much higher revenue to absorb the delivery costs. “Shouldn’t the margins be higher since we charge more for emergency work?” I naively asked. “Nope,” replied Sean McLaughlin, the head of operations. “We have to pay an arm and a leg to get people to respond to these emergency calls on a bitterly cold winter night. It is always a scramble. Costs are higher, and the administrative burden is also higher because you have to constantly field calls from the customers and then call them back with updates.” Looking at the numbers I guessed “So the maintenance revenue is lower because our people were focused on chasing down problems instead of staying on top of the planned work?” Sean snorted “That MIT education is paying real dividends for you right now, isn’t it?”
During a typical month, DunnWell would deliver between 92 – 96% of the planned maintenance, inspection, and repair work that was available under contract. We called this measurement the “due versus done” ratio. It represented the amount of work delivered and invoiced divided by the total amount which customers had authorized, either via a maintenance contract or an approved repair quote. To be strictly correct, it should have been called the “done versus due” ratio, but it was named before I got there, and “due versus done” had a better ring to it. That cold February, the “due versus done” ratio sagged downward to about 80%.
When the metric lagged, Joe Dunn, the largest shareholder in DunnWell, would remind everyone that “the customer has written a check and laid it on the counter, and we couldn’t be bothered to show up and cash it.” Put in those terms, it seems pretty silly to let anything get in the way of cashing a check, but it was surprising how often people with good intentions could become distracted by chaos and neglect to pick up those checks. The distractions typically take the form of some emergency, and in the case of this cold February month, the distraction was caused by frozen pipes and irate customers. But the February revenue was really good, and the overall margin was good, so what was the problem?
The problem is that not all margin dollars are equal. That sounds silly, but it is true. For this February period, DunnWell did not cash some checks for planned maintenance because we were busy cashing checks for emergency work. How do you suppose the customers that were due for planned maintenance felt when we did not show up as promised? How about the customers whose pipes burst? Do you suppose they were happy with the emergency response fees? And do you believe those emergency service dollars are going to show up consistently every February like contract maintenance dollars do? Nope. Emergency service calls by their very nature are unpredictable – the opposite of consistent results. So even though revenue was higher and overall margins were acceptable, that cold February was a failure. Just because the gross margin on every job is in an acceptable range does not mean that the business is performing in a way that maximizes value for the owners. The emergency “scramble” gets in the way of the Bernie Madoff lesson that teaches us that consistency is better.
So fraud is never a good road, but Bernie understood very well what investors want. You can take a lesson from his fraud and focus your business on minimizing the chaos and disruption of “break-fix” type services and instead attempt to maximize the revenue you receive from consistent revenue services like monitoring, inspections, planned maintenance, and planned retrofits and repairs. Next week, we will do a follow-on post to describe the metrics and give example management charts that you can use to be certain you are on the right road to maximizing the consistency of results to yield the highest value for your shareholders.
ServiceTrade sells software, so we spend a reasonable amount of time coming up with ideas and content (like this blog post) to help customers make better and faster decisions about buying software (preferably from ServiceTrade). We are particularly fond of catchy, summary phrases and slogans that are memorable for the same reason that consumer marketers come up with jingles that stick in our head. Humans are impressed by and gravitate to rhythm and rhyme (along with images and stories) as a mechanism for storing and retrieving information. It is easier to learn the lyrics to a song than to memorize a speech. If it has rhythm and rhyme, you are more likely to remember the phrase.
So what is the catchy breakthrough I am seeking with this post? I have been writing a lot about how to evaluate and purchase software applications to increase the value of your business. You can check out some of that content here, and here, and here. My latest breakthrough in measuring software value is what I call the “bank bandit barometer” (note the meter and alliteration of that phrase! nice huh?). Why did Jesse James rob banks? ‘Cause that’s where the money was held. Banks are more dense in money than restaurants, or retail outlets, or hotels, for example. A robber is going to get more bang for his buck (or more bucks for his bang if he has to deploy his weapons) by focusing on banks instead of these other cash-poor outlets.
So what does any of this have to do with software? Well, the “bank bandit barometer” for software purchases would say to look for software that helps bring more bucks into the business. What is the metaphorical bank for a service contractor? Where is all of the money? I would argue that the biggest hoard of cash to go attack with software is the cash that is in the hands of the prospective customers in your market. Cash that is currently being spent with other vendors or not being spent at all due to lack of attention. The potential customer spending in the addressable market that can be reached by your services represents probably 1,000 times your current revenue. Maybe only 100 times your revenue if you are a larger contractor in your market.
Contrast this bank vault of customer spending with the focus of most service contractor software consideration – how do I lower my payroll by being more efficient internally? How do I lower my administrative costs? By definition, your administrative costs are some small fraction of your overall revenue. Maybe 10%, or .1 times your current revenue. If you were a bandit, you would be doing poorly using software to “stick up” your administrative payroll. Wringing dollars from administrative payroll is like a bandit sticking up the local neighborhood kids lemonade stand. There just ain’t much money there, so any robbery that is focused on extorting dollars from the lemonade stand is doomed to marginal success at best.
So, what do you think about the “bank bandit barometer” for software purchases? Are you focusing on innovations that help you take more money from the bank that is the market you service? Innovations that help you sell to the customer accounts that you covet? Innovations that help you charge more? And deliver new capabilities? And attract a better class of customer to your business? Are or you content to hold up the lemonade stand because the poor kids running it are a soft target? Think like a bank bandit next time you go out shopping for software applications.
What’s Technology Worth? How to Value Your Technology Investments.
I hear customer prospects cry out for “the perfect application for my business that does everything” in nearly every sales call that I make. It does not exist. I have argued again, and again, and again that every business of any size will ultimately buy multiple applications to serve the diverse needs of their business functions.
Look at your phone. One application? Or many? Displaying the weather is different from transferring money from your bank account is different from measuring the intensity of your workout is different from keeping up with your social network.
Likewise, your accounting function is different from your sales function is different from your customer service function is different from your marketing function. The idea that one application will be sufficiently good for your business to remain competitive in all of these different functions is silly, and any software vendor promising you that outcome is a silly vendor. But what about the follow-on questions:
If I am going to buy many applications, how much should I expect to spend?
How do I value applications that make my business more competitive in a world where technology innovation increasingly determines market competitiveness?
Guideline 1: Select Modern Software With Open APIs
Well, before you even consider how much to pay, you need to perform the first and most basic test in the software buying cycle. Go to your favorite online search engine and enter the following query:
[INSERT NAME OF SOFTWARE APPLICATION HERE] API documentation
The first organic link below all of the advertisements from the software vendors that are trying to sell you a competing application should be a link maintained by the vendor of the application in question. That link should lead you to detailed documentation for how the application you are considering can be integrated with other applications that you use. Application Programming Interfaces (APIs) are the key to a new world of connected innovations for your business. Without good APIs that are publicly documented, the application you are considering is worthless. You should not pay anything for it.
Go ahead and try the search for a couple of high-quality applications that are on the market today. Insert “ServiceTrade” or “ZenDesk” or “PipeDrive” or “Marketo” or “Hubspot” or “Slack” into the query above. Check out the first organic link below the advertisements. What do you see? This query is the first test to determine if an application is worth at least a penny.
Guideline 2: Judge the Technology’s Value to Your Business
Let’s say that your application passes that first test. What now? How much is it worth? Well, it sort of depends on how much it increases the value of your business. In a prior blog post, I argued that the questions that determine the value of your business are How Many? How Much? and How Long? How many customers do you have and how many can you attract with your value proposition? How much can you charge those customers for the services that you provide to them? How long can you keep those customers when you are charging a significant premium compared to your low price competition? These are the questions that you should use to evaluate how much a new software application is worth to your business. The more the software impacts these measurements, the more you should be willing to pay because it is going to make your business more valuable.
Does the new application help me attract new customers? Does it help me charge them more because it provides my service with some new features that customers value? Does it help my business become sticky so that it is difficult for customers to fire me and replace my service with a low-cost competitor? If the answer to these questions is “yes, absolutely, definitely” then the application is probably very valuable. If the answer is “no, not really” then the application is only worth some fraction of the money it might help you save by eliminating administrative burden.
The problem is that you are probably significantly overpaying for administrative applications like accounting and underinvesting in applications that drive new customer acquisition, service differentiation, and revenue. And I also bet your accounting application provider is telling you “we have a plugin for sales, and customer service, and technician management, and every other thing you might need” in order to justify the crazy price you are paying for that application. Am I right? Probably.
So how can you alter your portfolio of applications through time to push down the expense associated with administrative applications so that you can reinvest those dollars in applications that actually drive up the value of your business to its shareholders? Applications that enhance your ability to add customers, charge them more for your services, and hold onto them longer?
Conclusion: Recommendations
My first recommendation is to only consider modern software as a service (SaaS) applications that have publicly documented APIs. These will generally be cheaper than the older, legacy server-based applications, and they will deliver more innovations to your business going forward. Software investors are NOT investing any of their precious capital in old server applications, so these legacy applications are going to stagnate and die. No point in throwing your money away on a dead horse.
My second recommendation is to ask the basic questions around How Many? How Much? and How Long? for new applications you are considering. If the applications you are considering do not contribute to these value metrics, then simply look for the low price alternatives that meet the SaaS and API criteria and determine how much administrative expense they might save you. You can spend up to 100% of the savings on the administrative applications to eliminate manpower spending.
If the applications do in fact help you attract more customers, charge them more for valuable new features, and hold onto them forever, open up the wallet and let fly for up to 2 – 3% of the revenue you expect to drive by being the most innovative service contractor in your market. I assure you that the best service contractors will collect a 15 – 25% revenue premium in their market, which easily justifies the spending on the applications that drive that differentiation. I will also assure you that competing on technology innovation is much more fun than competing on price.
Case Study: Investing 3% of Revenue in Technology
Let’s look at some examples from ServiceTrade’s business to set some benchmarks for how much to pay.
The biggest technology application expense category that ServiceTrade faces is for infrastructure services that power our customer’s experience with our product. Amazon and Google charge us for technology that provides neat features in our application. The ability to send a quote to a customer via an email with a link that presents the quote online with photos and video and audio and a “one click to approve” button that drives revenue for our customers is largely dependent upon capability provided to ServiceTrade by Amazon. The ability to map customer locations for scheduling efficiency, see the locations of the technicians in real time, and prefill the fields for setting up new customer location records is largely dependent upon capability from Google. The applications from Amazon and Google are VERY valuable to ServiceTrade because they help us attract new customers and charge them a premium, and we spend about 6% of our revenue on these types of applications.
Now, ServiceTrade makes about 80% gross margin on the applications we sell, so we can afford to spend heavily on making these applications great. If your service to your customer drives a lower margin, say 35%, then 6% of revenue makes no sense for any technology. The apples-to-apples comparison, in this case, is probably close to 7% of gross margin (roughly), which would equal 2.6% of revenue for an application that really helps you deliver differentiated value to your customer. So for a $10 million dollar service contracting business generating 35% gross margin, the equivalent amount would be $260,000 per year.
The next biggest category of technology expense at ServiceTrade is for sales and marketing applications. We have Salesforce, Marketo, Salesloft, and a handful of other applications that help us present our value proposition to customers in a way that drives new sales. These applications help us increase the How Many customers metric. We spend about 1.5% of revenue on these types of applications. Again, to adjust for gross margin, that would be about .6% of revenue for a 35% gross margin business. So for a $10 million dollar service contracting business with 35% gross margin, the equivalent annual expense would be $60,000.
The next biggest category of technology expense at ServiceTrade is for customer service oriented applications. These are the applications that help our engineers and our support staff keep track of how things are going for our customers and to monitor the application for errors or potential signs of trouble. We spend about .4% of revenue on these types of applications. They are tangentially oriented toward helping with the How Long can we keep our customers question. Clearly, these are far less valuable than Google and Amazon, and also less valuable than the sales and marketing applications, both of which help us drive up the How Many? and How Much? elements of our business value. Adjusting for gross margin again, and you get .16 as the percentage of the revenue in a 35% gross margin business. A $10 million service contracting business should consider spending $16,000 per year on customer service infrastructure.
Finally, there are the administrative applications like accounting, email, file sharing, calendar, reporting, office productivity, etc. These are the applications that every business needs, but their value is simply in keeping the administrative burden of running a “tight ship” as low as possible. ServiceTrade spends about .3% of revenue on these type of applications, and it is unlikely that the expense of these will scale linearly as we grow. When we double in size, I would expect that percentage of revenue to be about .2%. So for a $10 million dollar service contracting company generating 35% gross margin, the administrative applications in the business should be on the order of .08% of revenue, or about $8,000 per year on accounting, email, reporting, calendar, office productivity, etc.
If we total all of these up for a $10 million service contracting business, the percentage of revenue spent on technology applications is about 3.44% of revenue or about $344,000 per year. Now my ears are almost bleeding from the screams and bellows of “That’s Crazy!” that I can hear coming from service contracting customers reacting to this number. But is it so crazy? Are applications that help your business become competitive in attracting new customers, driving new revenue, and charging a premium price really worth that type of spending? Consider these two examples. How much do you pay for an application like Square that helps you collect money from a customer in the field? It consummates the sale by getting the cash now. You happily pay about 2.5% of revenue for this type of application. How about the central station monitoring application that enables you to sell a high margin monitoring service? You happily pay between 30% and 50% of revenue for this valuable addition to your service arsenal. So no, 3.44% of revenue is absolutely not crazy for a full set of applications that help you drive value in your business.