


5 Things that Service Companies can Learn from Google Analytics
Business owners and managers need reports to monitor the health of their business; to measure what works and what doesn’t, to see how they fit in the world around them, to find the best methods for gaining new customers. Part of that information can be gleaned from Google Analytics.

Google Analytics is free, robust and it can tell a service contractor a lot about their business today and trends over time. Things like:
- Who is coming to your website and how they got there
- What people are looking for when they come to your site
- If your conversion goals are being met
- What’s working to drive high-value visitors to your site
- If your content meets their needs
1. Who is coming to your site and how they got there.
The Audience section of Google Analytics can tell you a lot about your web visitors. Three of the most important and interesting to monitor are geography, network, and new vs. returning.
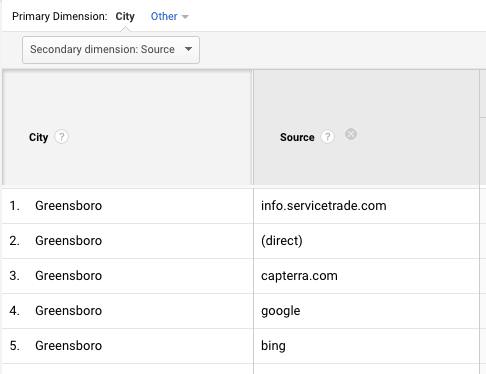
Geography will show you where your visitors are located. This is a good way to monitor your local SEO and ensure that you are reaching the people in locations where you work. Once you segment your web visitors by location, you can study them by other metrics, like source and goal conversions (more on that in a minute.)
For example, I can see that the majority of ServiceTrade’s visitors in the past month in Raleigh come to us direct, but most of our visitors in Greensboro are referred by our email outreach with the source info.servicetrade.com. Knowing that, I might be interested in browsing my recent email list for prospects located in Greensboro, and can start to cobble together an understanding of where those prospect(s) are interested in our web and email content.
Network is one of my favorites! It lists the internet service providers for your web visitors. For a lot of smaller companies and home users, this will be the name of their provider (like AT&T, Time Warner, or dozens of others), but for a lot of businesses, their network name will display as their company name. When you see a company name, you know immediately what customers and prospects have been on your site. It is fantastic for sales outreach.
Once I pick one of my prospects out of the Network list, I can see how many visitors came to the site and when. I can see their city and state. I can see their landing page. Their exit page. And I can see if they converted on any of my site’s goals.
Network data in Analytics can be used for sales optimization. And that’s why it’s my favorite.
New or Returning Visitors Keep track of how many new visitors come to your site in a time period and track it over the long term. Cross-reference your new user data against how they came to your site, and where they’re located. All of this information will help you understand where your customer acquisition programs are the most effective – and it’s one of the most important long term trends you can monitor.
2. What people are looking for when they come to your site.
There are a couple of ways to uncover what people are looking for when they come to your site.
By the pages they visit. Rank your content pages by number of page views. For ServiceTrade, the most visited page after our home page is pricing so we make it easy to find in our navigation. After pricing, we look at what feature pages are most visited to understand what problems our web visitors most want to solve. For service contractor websites, those pages will be the services you offer. Giving each service its own web page or section of your website will make it easier for you to later measure site engagement to see where your audience is interested.
By the keywords they search for. Visitors’ keyword search terms also tell you what people were looking for when they came to your site. Unfortunately, the keyword list is partially obscured in Google Analytics. Instead, search traffic and keyword performance data is shown in Google Search Console.
![]()
![]()
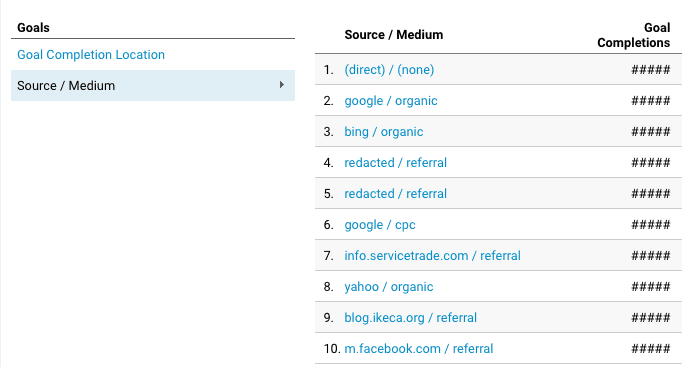
3. If your conversion goals are being met.
Analytics makes it easy to establish multiple goals for user behavior. You can get a total number of conversions for all of your traffic, and also segment it by any number of factors like network, geography, source, etc.
Set up a goal for your web forms and monitor what sources they come from. If you find a strong goal conversion through your listing on the local trade association website, you know that it’s a good place to invest your time and your money. On the other hand, if you’re investing in a program but not seeing goal conversions, you have a red flag.
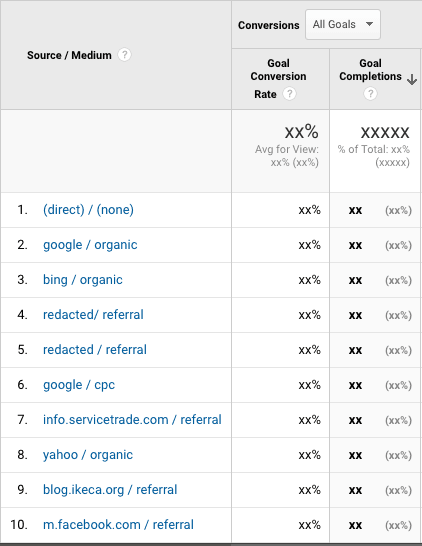
4. What’s working to drive high-value visitors to your site.
Which of your programs, online profiles, emails or whatever else you do is working? You can come at this information two ways:
- Look at where you are having success, i.e. goal conversions, and back track those visitors to their source
- Look at your traffic sources, then rank them by key performance indicators, i.e. goal conversions, time on site, new visitors, etc.
5. How your content is performing.
Did you see our post that ranked our top 10 blog posts of 2016? That ranking came directly from Analytics when we organized blog posts by the most visitors.
The Behavior section of Analytics measures how people engage with the different parts of your site. Valuable points to observe are your most visited pages, pages with the longest time on site metrics, top landing pages, top exit pages, and how visitors flow through your site. Once you’ve crunched this data, where are you surprised? Where are visitors spending more or less time than you expect? Does your site’s user experience make it easy for them to get to the most valuable information?
Schedule a Weekly Date with Google Analytics
Google Analytics is absolutely worth your time to study and uncover insights that aren’t just about your website, but about your audience that you can use to:
- Learn if your site is optimized for the right content and geography.
- Make decisions about where to invest your marketing dollars.
- Find those golden needles in the haystack that inform sales about which prospects and customers are actively engaged with your content.
- Monitor trends over time.
Your competition and Google’s ever-evolving algorithms make SEO a dynamic environment littered with factors that you can’t control. Analytics reporting is one way to see when things might be changing – whether it’s a temporary blip in the quiet weeks around the holidays – or the sign of trouble that needs to be researched and resolved.
My final parting advice is to have Evernote or your project management application open as soon as you delve into Analytics. You’ll think of a ton of data-driven ideas you’ll want to record and act on.